Ten years of different crop rotations in a no-tillage system – what happened to plant diseases and nematode pests?
Author: Ken Flower, Daniel Hüberli, Sarah Collins, Geoff Thomas, Phil Ward, Neil Cordingley | Date: 25 Feb 2019
Key Messages
- Yellow leaf spot (Pyrenophora tritici-repentis) was more prevalent in monoculture wheat and the cereal rotation compared to all other rotation sequences
- Fusarium spp. and Rhizoctonia solani were favoured by cereal dominated rotations
- Pythium spp. and Pratylenchus neglectus were favoured by more diverse rotations
- Farmers require up-to-date information on the host status of crops if rotation is going to be an effective broad-based control measure in a no-till system
Aim
To study the long-term effects of crop rotation and residue level on diseases and nematodes in Western Australian no-tillage systems.
Method
A long-term experiment was started in 2007 at the Cunderdin College of Agriculture in Western Australia. The current research reports on levels of major West Australian plant parasitic nematode and foliar and root diseases in 2016, which was ten years after the start of the experiment. The treatments were based on different rotations and two residue management levels. The rotations were wheat monoculture, cereal rotation (cereal/cereal/cereal), diverse rotation (cereal/legume/brassica), ‘typical’ farmer rotation (cereal/cereal/legume or chemical fallow) and a mown pasture plot (subterranean clover and grass/broadleaved weeds) (Table 1 – 2017 and 2018 are included to show the crops in the next three-year rotation, starting in 2016). Crop residue was retained by spreading at harvest until 2010, after which plots were split for retained and windrow burnt.
Table 1. Crop rotations from 2007 to 2018 (note a 3-year rotation was used with every crop in the rotation grown in every year – e.g. three plots in rep 1 of the cereal rotation in 2007 with barley, barley and oat CC).
Year | Cereal | Diverse | Farmer | Monoculture | Pasture |
|---|---|---|---|---|---|
2007 | Barley | Wheat | Wheat | Wheat | Wheat |
2008 | Barley | Vetch CC‡ | Barley | Wheat | Pasture |
2009 | Oat CC† | Canola | Lupin (angustifolious) | Wheat | Pasture |
2010 | Wheat | Wheat | Wheat | Wheat | Pasture |
2011 | Wheat | Field Pea | Barley | Wheat | Pasture |
2012 | Wheat | Canola | Field Pea | Wheat | Pasture |
2013 | Wheat | Wheat | Wheat | Wheat | Pasture |
2014 | Wheat | Chickpea | Barley | Wheat | Pasture |
2015 | Barley | Canola | Fallow | Wheat | Pasture |
2016 | Wheat | Wheat | Wheat | Wheat | Pasture |
2017 | Wheat | Lupin (albus) | Barley | Wheat | Pasture |
2018 | Barley | Canola | Fallow | Wheat | Pasture |
†Oat CC = Saia oat (Avena strigosa) cover crop.C = cover crop (grown for biomass and knife-rolled - not harvested).
‡Vetch CC = Purple vetch–oat (Vicia benghalensis and Avena sativa) mix as a cover crop.
Measurements
For the visual assessments of foliar disease, only wheat yellow leaf spot is reported here. The assessments were done at growth stage (GS) 31 and the percentage of the leaf surface covered by lesions was estimated on the top three (or four where present) fully expanded leaves.
Soil sampling was conducted in February/March (before seeding) in 2016 for major West Australian broadacre soilborne diseases and nematode pests. Samples were taken randomly on and off the previous year’s crop row to a depth of 10 cm using a coring device with a 25 mm diameter, with samples containing plant debris. Another sample was taken in-crop at the end of August, where 25 plants per plot with intact roots were collected in a zigzag pattern and brought back to the laboratory for bulking and assessment. Subsamples of soil and root (the latter was air dried) were sent for PREDICTA®B analysis by the South Australian Research and Development Institute (SARDI) (Collins et al., 2017).
Results
The split plots of fully retained residue and windrow burnt were introduced after the 2010 harvest. Burning the windrows in relatively narrow strips reduced residue levels by 40—60%, but had no significant effect on foliar or soilborne pathogens (data not shown).
Visual assessment of foliar disease
In 2016, the farmer rotation and diverse rotation had the lowest levels of wheat yellow spot (Pyrenophora tritici-repentis) on the leaves at 3% and 4% of the leaves covered by necrosis, respectively. The level of leaf necrosis was significantly greater in the monoculture with 20% and intermediate in the cereal rotation at 9%.
PREDICTA®B - Effect of rotation on level of foliar and soilborne pathogens and nematode pests
In 2016, after 10 trial cropping seasons, pythium root rot in diverse rotation and pasture were at significantly higher levels than the cereal or farmer rotations and the wheat monoculture (Table 2). Yellow leaf spot DNA levels were significantly higher in the monoculture wheat and cereal rotation compared with the diverse rotation and farmer rotation, and were lowest in the pasture.
As expected, the level of field pea blackspot was lowest in the cereal rotation and wheat monoculture. It was highest in the diverse rotation and pasture, because of the field peas grown in the diverse rotation and, presumably, the subterranean clover in the pasture (Table 2). In terms of risk of crop yield loss (SARDI Broadacre Soilborne Disease Manual, PREDICTA®B), potential yield loss risk from blackspot was low for the diverse rotation (1.2—<2.0) and below detection for the rest (<1.2) (Table 2).
After ten consecutive cereal crops, crown rot levels were highest in the cereal rotation followed by wheat monoculture. The PREDICTA B risk of yield loss for crown rot was classified as medium for the cereal rotation (0.7—1.2), low for farmer, wheat monoculture and pasture (0.1—<0.7), and below detection (<0.1) for the diverse rotation. The risk categories developed in 2018 for crown rot take into account that stubble was not added to the soil samples. Plots will be resampled with stubble, for PREDICTA®B in 2019.
Levels of rhizoctonia root rot were greatest in the cereal rotation after 10 seasons followed by monoculture wheat and the farmer rotation, which had two out of three cereals. However, the risk of yield loss from rhizoctonia root rot was considered low (0.5—<1.5) for these three treatments and below detection (<0.5) for the diverse rotation and pasture.
Highest levels of root lesion nematode (P. neglectus) were found in the pasture and diverse rotations, which were significantly greater than the cereal rotation and farmer rotation. In terms of risk of yield loss, levels of root lesion nematode were at a low risk for the farmer rotation and medium (2.0—<15) for the other rotations. No cereal cyst nematode or stem nematode were detected (Table 2).
Table 2. Level of major soil pathogen and nematode pests (DNA, eggs and nematode number) for the different crop rotations, measured by PREDICTA®B before seeding (March) in 2016, after 10 cropping rotation seasons. Different letters after the numbers indicate significant differences at P ≤0.05 (no letters = not significant).
Disease/nematode | Cereal | Diverse | Farmer | Monoculture | Pasture |
|---|---|---|---|---|---|
Didymella pinodes / Phoma pinodella (Log10 pg DNA g-1) (field pea blackspot) | 0a | 1.5c | 0.5b | 0.2ab | 1.1c |
Bipolaris sorokiniana (pg DNA g-1) (common root rot) | 0.6 | 0 | 0.8 | 0 | 0 |
Fusarium spp. (Log10 pg DNA g-1) (crown rot) | 0.8c | 0a | 0.1ab | 0.5bc | 0.1ab |
Rhizoctonia solani AG8 (Log10 pg DNA g-1) (rhizoctonia root rot) | 1.2b | 0.2a | 0.8ab | 0.8ab | 0.4ab |
Pythium spp. (pg DNA g-1) (pythium root rot) | 10.7a | 62.4b | 16.3a | 6.7a | 72.7b |
Gaeumannomyces graminis var. tritici (pg DNA g-1) (take-all) | 0.9 | 1.4 | 0.8 | 0.8 | 1.8 |
Pyrenophora tritici-repentis (copies DNA g-1) (yellow leaf spot) | 153,135b | 50,941a | 24,664a | 279,019b | 7,624a |
Pratylenchus neglectus (nematodes g-1) (root lesion nematode) | 3.2b | 5.9c | 1.7a | 2.6ab | 4.7bc |
Heterodera avenae (eggs g-1) (cereal cyst nematode) | 0 | 0 | 0 | 0 | 0 |
Ditylenchus dipsaci (nematodes g-1) (stem nematode) | 0 | 0 | 0 | 0 | 0 |
Root lesion nematode (RLN) in different crops in the rotation
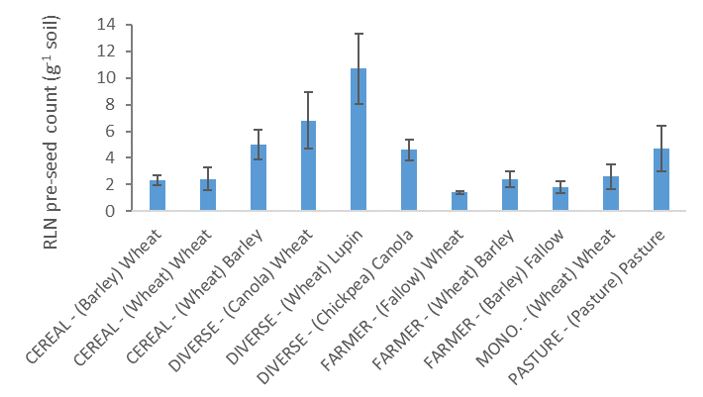
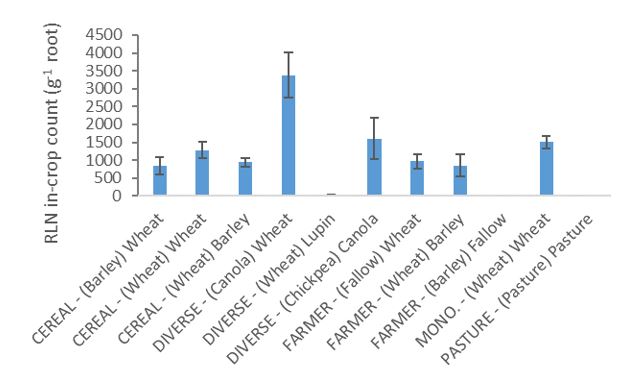
Numbers of RLN in the soil before seeding in 2016 were highest following wheat the previous year in the diverse rotation and lowest after fallow in the farmer rotation (Fig. 1). All sequences except the fallow had been sown with crops susceptible to RLN in the previous year (2015). RLN in the roots of plants in the 2016 season was highest in wheat from the diverse rotation followed by canola in the same rotation and wheat and barley in the farmer rotation and cereal rotation (RLN yield loss risk – low = 0.1—2.0 g-1 soil, medium = 2.0—<15 g-1 soil). There were very few nematodes counted in the roots of lupin (Fig. 2).
Fig. 1. Root lesion nematode (Pratylenchus neglectus) counts (nematodes g-1) in the soil before seeding in 2016 in different crops in the rotations (CEREAL, DIVERSE, FARMER, MONOCULTURE and PASTURE). The previous (2015) crop shown in brackets, followed by crop sown in 2016. Error bars show ±SE (n=3).
Fig. 2. Root lesion nematode (Pratylenchus neglectus) counts (nematodes g-1) on crop roots in different crops in the rotations (CEREAL, DIVERSE, FARMER, MONOCULTURE and PASTURE). The previous (2015) crop shown in brackets, followed by crop sown in 2016. Error bars are ±SE (n=3). Note root assessment was not done in the fallow.
Rhizoctonia in different crops in the rotation
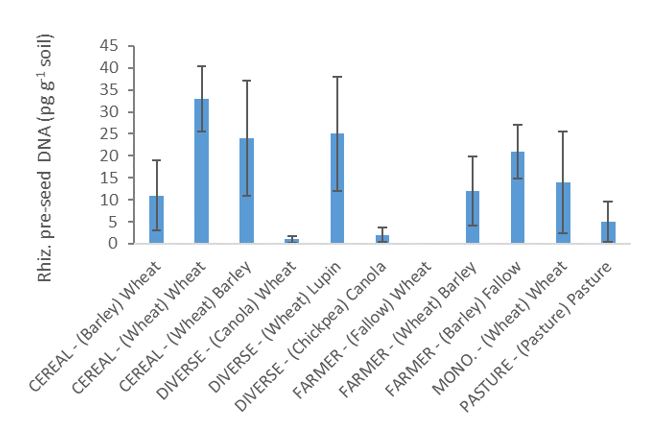
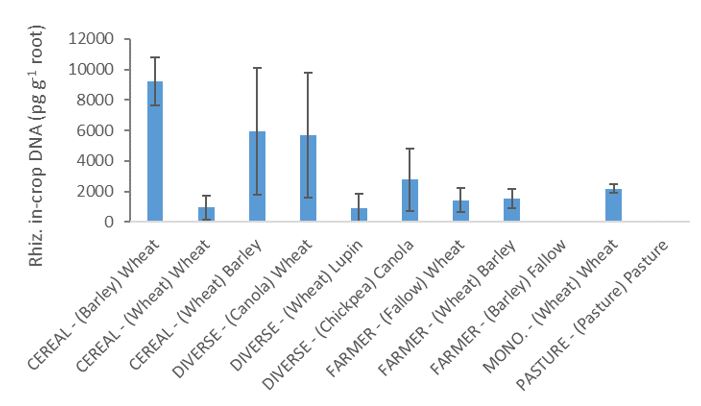
Pre-seeding soil R. solani DNA was lowest following canola, chickpea, and fallow (none detected) and significantly higher following wheat in the cereal rotation, wheat in the diverse rotation and barley in the farmer rotation (Fig. 3). However, in-crop root R. solani DNA showed no significant differences between any of the crops/sequences, due to high variability between replicates. Nonetheless, levels again tended to be highest following the cereals in the cereal and diverse rotations (Fig. 4).
Fig. 3. Rhizoctonia solani AG8 DNA (pg g-1) measured in 2016 in soil before seeding in different crops in the rotations (CEREAL, DIVERSE, FARMER, MONOCULTURE and PASTURE). The previous (2015) crop shown in brackets, followed by current 2016 crop. Error bars are ±SE (n=3).
Fig. 4. Rhizoctonia solani AG8 DNA (pg g-1) measured in 2016 on crop roots in different crops in the rotations (CEREAL, DIVERSE, FARMER, MONOCULTURE and PASTURE). The previous (2015) crop shown in brackets, followed by the crop sown in 2016. Error bars are ±SE (n=3).
Conclusion
Although monoculture wheat generally had the highest levels of soilborne disease and RLN after ten years, levels were still relatively low, which was surprising; although minimal stubble was included for the crown rot assessment. It is possible that the soil biology developed some disease suppressive characteristics, particularly under the relatively low nitrogen status of this treatment, as found Chen (2007), Hu et al. (2017) and Gair et al. (1969). Further research on this aspect is needed.
Perhaps the greatest most obvious threat to wheat yields were from the higher levels of wheat yellow spot that developed in monoculture wheat, with relatively high levels also found in the cereal rotation. The high levels of wheat yellow spot in the cereal rotation was likely due to the high frequency of wheat in that system since 2010. The chemical fallow after barley in the farmer rotation appeared to be as effective in reducing levels of yellow spot as having canola after legume in the diverse rotation. Greater yellow spot severity at the stem extension stage increases the risk of yield loss and may necessitate additional cost of fungicide application at this time (Beard and Smith, 2012).
The various crop rotations affected RLN (P. neglectus) and soilborne pathogen levels differently. The combination of canola and wheat, along with susceptible chickpea, appeared to favour root lesion nematode. In contrast, fallow and lupin in the farmer rotation appeared most effective at reducing P. neglectus levels. The relatively high RLN numbers in the pasture was likely due to susceptible weeds and subterranean clover (Vanstone et al., 2017a, Vanstone et al., 2017b). These results are consistent with the known data on RLN susceptibility (RLS tips and tactics). The crop selections in the diverse rotation of this experiment have generally been a poor choice in terms of their susceptibility to P. neglectus, our main nematode threat.
There were higher levels of Pythium spp. in the pasture and diverse rotation, because susceptible plants like legumes and canola were grown (Pankhurst et al., 1995; Harvey, 2004; Harvey et al., 2008). Pythium spp. levels were lowest in the cereals.
R. solani was significantly greater in the soil following cereals compared with canola, chickpea and fallow. The large build-up of inoculum that occurs in the presence of cereals compared to canola, chickpea, and fallow has also been shown in a broad scale rotation survey conducted in WA (Harries et al., 2015). Nonetheless, the break crops appeared to have only had a relatively short-term effect on levels of R. solani, which is consistent with previous work.
These differences in disease and nematode susceptibility between crop types demonstrate the need for up-to-date information on the host status if rotation is going to be an effective broad-based control measure.
Acknowledgments
This research was a co-investment by the Grains Research and Development Corporation (GRDC). The authors also acknowledge the College of Agriculture Cunderdin for providing the trial site and SARDI for the PREDICTA®B analyses.
GRDC Project Number: UWA00174
® Registered trademark
References
Beard, C., Smith, A., 2012. Early fungicide application can be profitable for managing yellow spot and Stagonospora nodorum in wheat-on-wheat cropping. WA Agribusiness Crop Updates, 28-29 February, Perth. pp. 30-33.
Chen, S., 2007. Suppression of Heterodera glycines in soils from fields with long-term soybean monoculture. Biocontrol Sci. Technol. 17, 125-134.
Collins, S.J., Wilkinson, C.J., Hunter, H.F., Kelly, S.J., Mckay, A.C., 2017. Tools for the detection and quantification of a specific root lesion nematode in soil and roots. In: Hollaway S, Simpfendorfer S, Mckay A, Sigel L, eds. Soilborne Diseases Symposium. Sydney, Australia, 31-2.
Gair, R., Mathias, P.L., Harvey, P.N., 1969. Studies of cereal nematode populations and cereal yields under continuous or intensive culture. Ann. Appl. Biol. 63, 503-512.
Harries, M., Anderson, G., Hüberli, D., 2015. Crop sequences in Western Australia: what are they and are they sustainable? Findings of a four-year survey. Crop Pasture Sci. 66, 634-647.
Harvey, P.R., 2004. Crop rotation could reduce Pythium root rot. Farming Ahead 154, 38-40.
Harvey, P.R., Warren, R.A., Wakelin, S., 2008. The Pythium-Fusarium root disease complex - an emerging constraint to irrigated maize in southern New South Wales. Aust. J. Exp. Agr. 48, 367-374.
Hu, W., Samac, D.A., Liu, X., Chen, S., 2017. Microbial communities in the cysts of soybean cyst nematode affected by tillage and biocide in a suppressive soil. Appl. Soil Ecol. 119, 396-406.
Pankhurst, C.E., McDonald, H.J., Hawke, B.G., 1995. Influence of tillage and crop rotation on the epidemiology of Pythium infections of wheat in a red-brown earth of South Australia. Soil Biol. Biochem. 27, 1065-1073.
Vanstone, V.A., Russ, M.H., 2001a. Ability of weeds to host the root lesion nematodes Pratylenchus neglectus and P. thornei. I. Grass weeds. Australas. Plant Path. 30, 245-50.
Vanstone, V.A., Russ, M.H., 2001b. Ability of weeds to host the root lesion nematodes Pratylenchus neglectus and P. thornei. II. Broad-leaf weeds. Australas. Plant Path. 30, 251-8.
GRDC Project Code: UWA00174,
Was this page helpful?
YOUR FEEDBACK


