The effect of variety and regional nutrition strategies on crown rot severity in Merredin
Author: Kylie Chambers, Jenni Clausen, Andrew Van Burgel, Dave Meharry and Vanessa Stewart | Date: 26 Feb 2019
Key Messages
- In 2017, the crown rot index (incidence x severity) of wheat was influenced by nutrition strategy, with disease index being the greatest at the highest N rate. There was a strong negative correlation between crown rot index and yield under different nutrition strategies.
- In 2017, the crown rot index of barley was only influenced by variety: nutrition had no significant effect.
Aims
To determine the effect of common district nutrition packages in Merredin on crown rot index (incidence x severity) of wheat and barley varieties.
Method
Yardstick demonstration trial details
The Merredin and District Farm Improvement Group (MADFIG) conducted a series of “yardstick” trials (2015 – 2017) to investigate the performance of wheat and barley varieties under different district nutrition strategies based on rainfall deciles (Clausen et al. 2018). Prior to harvest, observation of the 2017 yardstick trial identified that there was crown rot across the site. The 2017 season Yardstick trials were situated adjacent to the wheat and barley National Variety Trials (NVTs) on a clay loam soil. Each wheat and barley trial was a complete randomised block design with three replications (Clausen et al. 2018). Trials were dry sown 6 May 2017 with opening rain of 11 mm received on 11 May. The growing season rainfall was 191 mm (Decile 3).
Table 1: Site 0-10 cm soil properties
Total N mg/kg | P mg/kg | OC % | EC ds/m | pH CaCl2 |
|---|---|---|---|---|
17 | 33 | 0.7 | 0.100 | 5.9 |
Six barley varieties: La Trobe, Scope CL, Compass, Fathom, Spartacus CL, and Rosalind.
Fourteen wheat varieties: Calingiri, Chief, Cobra, Cutlass, Emu Rock, Hydra, Impress CL, Mace, Magenta, Ninja, Scepter, Supreme, Trojan, and Zen.
Four nutrition treatments, each representing district fertiliser strategies based on rainfall deciles and budget considerations.
Decile 1: 0 N, 0 P kg/ha
Decile 4-5: 10 N, 5 P kg/ha at seeding
Decile 7-8: 30 N, 5 P kg/ha at seeding
Play the season: 30 N, 5 P kg/ha at seeding and 20 N kg/ha at 7 weeks post seeding
Soil inoculum levels
The background pathogen and nematode pest levels of the paddock were determined by PREDICTA B testing. The soil sample was collected using the standard PREDICTA B sampling protocol without the addition of stubble (as the paddock was sown to canola in 2016) and sent to the South Australian Research and Development Institute (SARDI) for analysis.
Crown rot scoring
The stubble of 25 randomly selected plants were carefully removed from each plot to include the base of the stem and crown. The mean crown rot index for each plot was then calculated using the equation below (Forknall et al. 2019).The crown rot severity was determined using the using the 0–3 crown rot rating scale (Forknall et al. 2019; whereby 0= no browning, 0.5 = partial browning up to 2cm, 1= complete browning 0-2cm, 1.5= complete browning 0-2cm and partial browning 2-4cm, 2= complete browning 0-4cm, 2.5= complete browning 0-4cm and partial browning 4-6 cm and 3= >6cm of basal browning).

Two way ANOVAs were conducted using GenStat® 18th Edition statistical software (VSN Intl. Ltd). Correlations between crown rot severity and yield were calculated for all significant parameters.
Results
Initial PREDICTA B testing of the site showed a high level of disease risk for crown rot (2.4 log pg DNA/g soil) and a low disease risk for the root lesion nematode, Pratylenchus neglectus (4.6 nematodes/g soil). Crown rot symptoms, including whiteheads and basal browning, were observed in season.
Barley
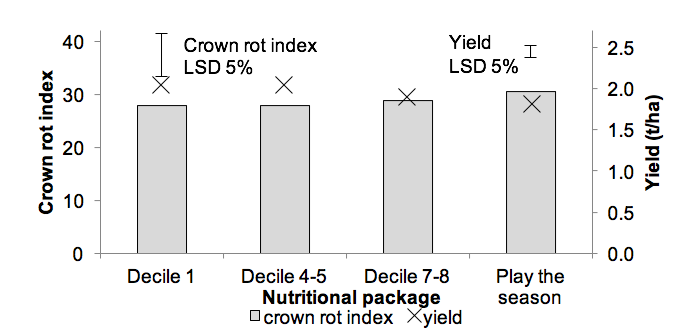
There was no significant interaction between barley variety and nutrition on crown rot index (incidence x severity; p>0.05) in this analysis or yield (Clausen et al. 2018). There were also no significant differences in crown rot index between the nutrition strategies (Figure 1; p>0.05). This is in contrast to previous studies, which showed that crown rot incidence and severity increased with increasing nitrogen levels in both wheat and barley (Blackhouse et al. 2007; Davis et al. 2009; Simpfendorfer S., NSW DPI personal comm.). However, the district practice levels of N application utilised in this trial are lower than those applied in the trials where differences have been reported. While the treatment differences were not significant, they were trending similarly to previous studies. These studies suggest that eastern wheatbelt district practice N rates may not be at a level to influence crown rot stem symptom expression for barley. However, this trial only represents a single season of data so more work is needed to confirm this over multiple seasons.
Clausen et al. (2018) found that the highest yielding fertiliser regime in the yardstick trial series was seasonally dependant. In 2017, higher fertiliser treatments yielded significantly less than the nil and decile 4-5 treatments (Figure 1; Clausen et al. 2018). The crown rot severity data suggests that crown rot may not have been the cause of the lower yield in the higher nitrogen treatments.

Figure 1: The effect of nutrition on yield and crown rot index in barley
Crown rot index and yields represent the average for the six barley varieties.
Decile 1 = 0 P, 0 N kg/ha; Decile 4-5 = 10 N, 5 P kg/ha at seeding; Decile 7-8 = 30 N, 5 P kg/ha at seeding; Play the season = 30 N, 5 P kg/ha at seeding and 20 N kg/ha post emergent.
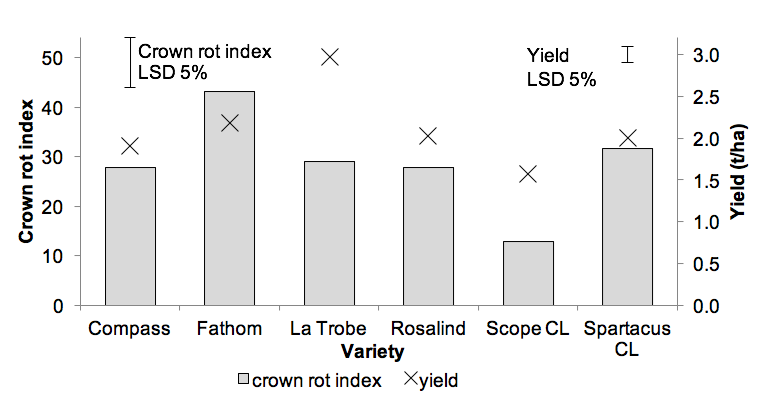
Crown rot index scores significantly differed between varieties (p<0.001), with Scope CL having significantly lower, and Fathom higher crown rot index than the other varieties (Figure 2). There was a moderate correlation between crown rot index and grain yield across all nutritional strategies (Pearson correlation coefficient (r) = 0.44), showing that varieties with higher yields tended to also have a higher crown rot index. The varietal differences seen in this study confirms previous research undertaken in Merredin, where Scope CL was found to have the lowest disease score, Compass and La Trobe an intermediate, and Fathom the highest disease severity (Hüberli et al. 2017.).

Figure 2: The effect of barley variety on yield and crown rot severity
Crown rot index and yields represent the average for all nutritional treatments.
Wheat
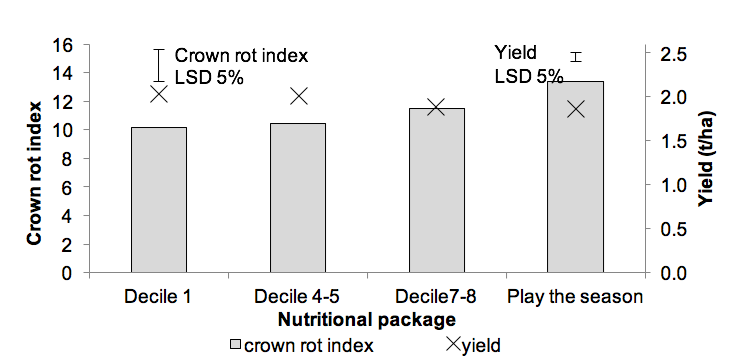
There was no significant interaction between variety and nutrition on crown rot index (p>0.05) or yield in wheat (Clausen et al. 2018). There was a significant difference in crown rot index in wheat between the different nutrition strategies (p<0.05), which was greatest at the highest N rate (Play the season strategy; Figure 3). Increases in crown rot incidence and severity with increasing nitrogen have been noted in wheat under different nitrogen management in previously published trials (Blackhouse et al. 2007; Davis et al. 2009; Simpfendorfer S., NSW DPI personal comm.). The district practice levels of N application in the Eastern wheatbelt are not as high as those applied in published trials or in other higher rainfall regions of Australia. This data suggests that N rates may have the potential to influence wheat crown rot stem symptom expression in growers’ paddocks. More work needs to be done to confirm this over a range of seasons.
Clausen et al. (2018) found that the highest yielding fertiliser regime in the yardstick trial series was seasonally dependant. In 2017, the high nutritional packages yielded less than the lower nutritional packages (nil and decile 4-5). The crown rot severity correlated with yield for nutrition (r= -0.90) suggesting that crown rot severity may be a contributing factor of reduced yield in the higher nutritional treatments.

Figure 3: The effect of nutrition on yield and crown rot index in wheat
Crown rot index and yields represent the average for the 14 wheat varieties.
Decile 1 =0 P, 0 N kg/ha; Decile 4-5= 10 N, 5 P kg/ha at seeding; Decile 7-8= 30 N, 5 P kg/ha at seeding; Play the season= 30 N, 5 P kg/ha at seeding and 20 N kg/ha post emergent.
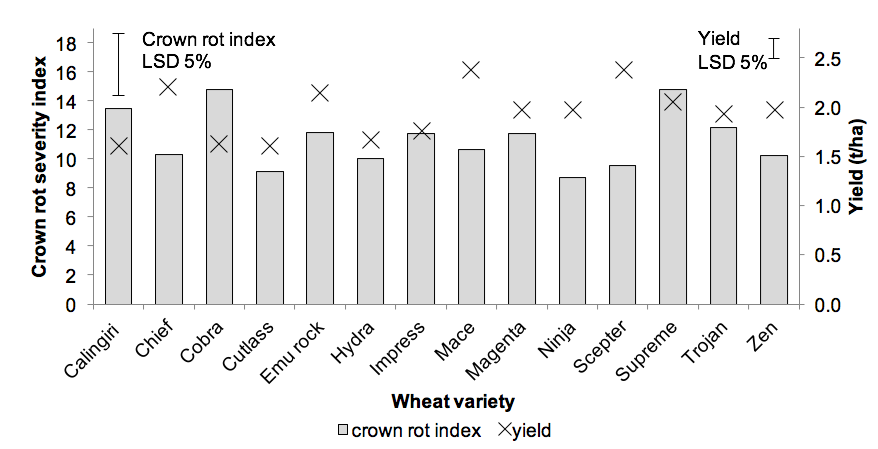
Variety had a weakly significant effect on crown rot index (p=0.09; Figure 4) which suggests that variety may impact on crown rot severity. Other studies including Huberli et al. (2017) have shown that crown rot severity is heavily impacted by varietal choice, however, in this study the crown rot index is quite low which may mean that variety may not have the same impact it does at higher crown rot levels.

Figure 4: The effect of wheat variety on yield and crown rot index
Crown rot index and yields represent the average for all nutrition treatments.
Conclusion
The development and impact of disease is influenced by several factors including environmental conditions, pathogen levels, crop and variety choice, and management decisions including nitrogen application.
There was no significant interaction between variety and nutrition on crown rot index (incidence x severity) in wheat or barley. The study by Clausen et al. 2018 also showed that there was no interaction between variety and nutrition on yield in the same trial.
While previous studies have shown that higher nitrogen levels have increased crown rot incidence and severity, these studies investigated nitrogen levels much higher than that used in the eastern wheatbelt. Looking at district nitrogen levels, we have shown that the crown rot expression in wheat can be influenced by the district nutrition strategy used, whilst in barley there was no significant difference across the nutritional strategies in 2017. In wheat, there was a strong correlation between yield and crown rot severity, suggesting that crown rot could be a contributing factor to the reduced yields in those treatments.
Varietal differences in crown rot severity were observed in barley. For barley, variety differences in crown rot severity did have a moderate correlation with yield. This suggests that while selecting varieties with good crown rot tolerance may reduce the impact of crown rot, there are also other factors to consider when selecting variety.
Further investigation of the effect of nutritional strategies and varieties on crown rot incidence and severity is required over several seasons to understand the impact that regional nutritional strategies have on crown rot expression in wheat and barley and to assist growers in making variety and nitrogen application decisions.
Acknowledgments
The research undertaken as part of this project is made possible by the significant contributions of growers through both trial cooperation and GRDC co-investment; the author would like to thank them for their continued support.
This project was supported by GRDC, DPIRD, MADFIG and Royalties for Regions investment through projects: DAW00256 (Building crop protection and production agronomy R&D capacity in regional Western Australia project) and MDF00001 (Reducing variety selection risk through understanding varietal performance with different management strategies).
Thank you to the Crook family for hosting the 2017 trial; Living Farm for trial establishment and seasonal management; Cam Wild and Irena Rodenberg for assistance in the field.
Article reviewed by Dr. Daniel Hüberli (DPIRD).
GRDC Project Number: DAW00256 and MDF00001
References
Blackhouse, D. (2007). Field studies and management of crown rot in the Northern Region. GRDC Final report. UNE62 - Field Studies And Management Of Crown Rot In The Northern Region
Clausen, J., Meharry, D., Smith, R., Stewart, V. and van Burgel, A. (2018). Yardstick trial: A grower group’s solution to reducing wheat and barley variety selection risk in their low rainfall farming system. In: 2018 Grains Research Updates, Perth, Western Australia, 26–27 February.
Davis, R. A., Huggins, D. R., Cook, J. R. and Paulitz, T. C (2009). Nitrogen and crop rotation effects on fusarium crown rot in no-till spring wheat. Canadian Journal of Plant Pathology 31(4), 456-467.
Forknall, C. R., Simpfendorfer, S. and Kelly, A. M. (2018). Using yield response curves to measure variation in the tolerance and resistance of wheat cultivars to Fusarium crown rot. Phytopathology, Using yield response curves to measure variation in the tolerance and resistance of wheat cultivars to Fusarium crown rot
Hüberli, D., Gajda, K., Connor, M. and Van Burgel, A. (2017). Choosing the best yielding wheat and barley variety under high crown rot. In: 2017 Grains Research Updates, Perth, Western Australia, 27 - 28 February.
Varieties displaying this symbol beside them are protected under the Plant Breeders Rights Act 1994.
Was this page helpful?
YOUR FEEDBACK
