The role of local carbonate sources and cultivation on the acid sandplain in the Eastern Wheatbelt
Author: Caroline Peek, Greg Shea and Mario D’Antuono, DPIRD | Date: 26 Feb 2019
Key Messages
- Local sources of carbonate performed as well as limesand on an acidic eastern wheatbelt sandplain, in terms of yield, particularly in conjunction with cultivation.
- Cultivation with offset discs performed as well as deep ripping treatments, in terms of yield, in 2017 and 2018.
- Local carbonate sources raised the soil pH in the top 15 cm. Cultivation with offset discs changed the distribution of pH in the top 15 cm compared to nil cultivation and deep ripping.
- Local carbonate sources tested typically had higher levels of fine particles <0.075 mm than limesand and this needs to be taken into consideration when calculating effective neutralising value.
- Local carbonate sources have variable neutralising values, so it is important to assess the quality to determine application rates and relative cost compared to other lime.
Aims
Sandplain soils common in the eastern wheatbelt are often naturally low in pH and high in aluminium, and cropping continues to acidify these soils (Gazey et al. 2013). Some of these soils are also prone to subsoil compaction (Van Gool 2016). Many growers in the eastern wheatbelt find the transport cost of coastal limesand to be prohibitive at the rates required to ameliorate these soils. Growers are interested in the idea of identifying, extracting and applying local carbonate sources.
This experiment investigated the effectiveness of local alternative carbonate sources and their interaction with shallow cultivation and deep ripping on alleviating subsoil acidity and compaction.
Method
The trial is located near Kalannie (S30.4183, E117.2934) on an acid sandy earth with pH (CaCl2) 0-10 cm: 4.6-5.0 and 10-80 cm: 4.0-4.3. Aluminium levels ranged from >5mg/kg at 15cm and were as high as 26 mg/kg at 50 cm. The trial had a criss-cross design with three randomised replicate blocks where the cultivation treatments were crossed with the ameliorant treatments at right-angles in each replicate (GenStat Statistics Guide 19th Edition). The randomisation was different for each replicate block. The plots were designed so that they could be split in the future.
The ameliorant and cultivation treatments were applied in March 2017. The farmers (Nixon family) sowed the trial to Scepter wheat in May in 2017 and 2018 with 50kg/ha K-till and 50kg/ha Agstar. Seasonal Nitrogen was also applied. The trial was harvested by a plot header. Grain quality was measured using an Infratech™Nova and the grain size distribution was measured using a Sortimat.
Stastical analysis was to fit a linear mixed model via the REML procedure to the basic criss-cross design and a spatial correlation model was fitted to take into account the unequally spaced plot sizes/distances using a power correlation in REML procedure.
Soil samples were taken from the plots in 2017 down to 80cm before the treatments were applied. The average 0-10cm Colwell P was 23ppm and the average OC% was 0.98%. Colwell K was 0-10 cm 58ppm, 10-20 40ppm, 20-30 40ppm and 30-40 37ppm. The crop was tissue-tested in 2016 to pick up any potential nutritional issues when selecting the site and there were none at that time. Soil samples were taken again in 2018. The plots were sampled at 5 cm intervals with an air drill down to 30 cm and with an exhaust pipe from 30 cm to 50 cm (because of increased soil moisture). Tissue testing was done in the late stage boot of the flag leaves in 2017 and early stem elongation in 2018 sampling the youngest fully expanded blade to pick up any potential nutritional issues. NDVI was determined using a hand-held GreenseekerTM and also from drone imagery.
Twenty penetrometer readings were taken in a grid across the site down to 50 cm at 2.5 cm intervals before the treatments were applied. The site had moderate compaction (Figure 1). In general, crop root growth starts to be restricted when the penetration resistance exceeds 1500 KPa and is severely restricted at 2500 KPa or more. (Hunt and Gilkes 1992).
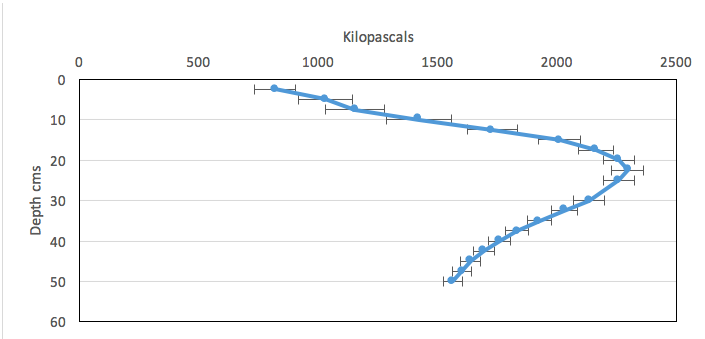
Figure 1: Average of 20 penetrometer readings (with standard error bars) at each depth. Data collected in 2017 prior to the application of treatments.
Cultivation
The trial had four cultivation treatments applied in May 2017: offset discs to 15cm, nil cultivation, deep rip to 50 cm and deep rip with inclusion plates to 45 cm.
Carbonate Ameliorants
The Nixon family identified a local carbonate source on an area of Morrell soil on their farm. This provided the local carbonate treatments for the trial. The subsoil was extracted and the larger rocks (> 10 mm) screened out (Morrel subsoil treatment). The rocks have a higher neutralising value so they were finely crushed and screened over a 2.00 mm sieve by Watheroo Dolomite for the trial (Crushed Rock treatment). An unprocessed low NV bulk Morrell soil sample from another paddock with no rocks was used as a source (Bulk soil treatment). Limesand was the standard carbonate comparison.
4t/ha limesand was chosen as a rate that would raise the top 0-10cm to pH 5.5 and the 10-30cm to pH 4.9 (Soil amelioration calculator Liebe Group website). Trials looking more closely at rates of limesand were conducted in the same paddock (Azam et al. 2019) so only 4 t/ha limesand was used in the trial. The high rates of the local Morrel subsoil carbonate source was calculated to be the equivalent of 4 t/ha of the limesand by using initial NV and wet sieve particle analysis results to calculate ENV using the Soil Quality 2017 “Lime Benefit Calculator” (WA). The calculation for finding the 4t/ha limesand equivalent was ((ENV of the limesand /ENV of the local carbonate source) *4). This was also confirmed in the Soil amelioration calculator. The Crushed Rock ameliorant could only be crushed by Watheroo Dolomite just prior to the trial so the rate had to be estimated based on initial NV analysis of the rock and estimated particle size range based on crushed Watheroo dolomite products and calculated as 9t/ha. The actual equivalent to 4 t/ha limesand once the particle size analysis was done is 8.3t/ha. The bulk soil had variable tests and the 4t/ha limesand equivalent was calculated as between 27 and 30t/ha. Lower rates of the local carbonate treatments were applied to correspond with rates that a local farmer might spread and to provide more information regarding rates. (Table 1). The equivalent rates of limesand are shown in Table 1. The Morrel soil carbonate used for the local carbonate treatments often contains large aggregates that slake in water, so the distribution of particle sizes differs between dry and wet sieve analysis (Figure 2). Wet and dry sieve analyses were done on all the carbonate sources several times.
In addition to the WA calculator, ENV was calculated using a method based on research by Scott et al (1992, NSW Agriculture lime comparison calculator 2003) (Table 1). Both calculators discount NV based on particle size distribution, but the NSW calculator begins discounting at a particle size greater than 0.075 mm, whereas the WA calculator begins discounting at greater than 0.5 mm. The NSW version results in a comparatively heavier discounting of the limesand compared to the alternative carbonate sources (Table 1), which have a higher proportion of very fine material (Figure 2).
Table 1: Rates of ameliorants spread in 2017 and 2018. The equivalent rates of limesand are listed for comparison. The effective neutralising value (ENV) calculated using the WA calculator and NSW calculator, based on wet sieving, and total neutralising value (NV) are also given.
Ameliorants applied 2017 | Application rate t/ha | Equivalent limesand rate t/ha | Wet sieve ENV% (WA calculator) | Wet sieve ENV% (NSW calculator) | Total NV% |
|---|---|---|---|---|---|
Limesand | 4 | 4 | 87 | 42 | 88 |
Morrel subsoil | 5.5 and 11 | 2 and 4 | 32 | 28 | 45 |
Crushed Rock | 4.5 and 9 | 2.2 and 4.4 | 43 | 33 | 72 |
Bulk soil | 30 | 4.4 | 13 | 10 | 13 |
Nil |
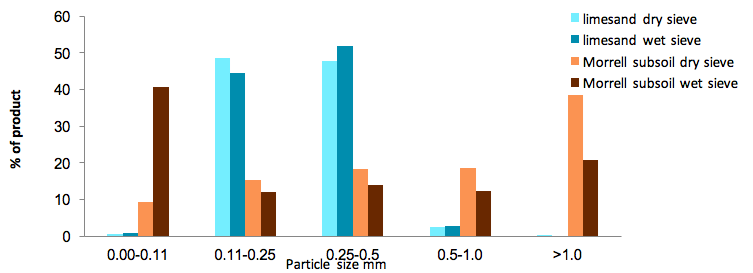
Figure 2: Wet and dry sieve comparison analysis of particle size distribution for limesand and the screened Morrel subsoil used in the trial.
Local lime Source Survey
A range of local carbonate sources from Southern Cross to Kalannie collected by eastern wheatbelt farmers were tested for particle size distribution using the wet sieve method. Each particle size range was tested for neutralising value. Some of these sources were also tested for total potassium and Colwell K which measures the plant available K in solution. The Colwell K for the Morrel subsoil indicate that K content was 332g/tonne and 630g/tonne for the Bulk soil.
Results
Cultivation response
In 2018, deep ripping and offset discs increased yield by 221 kg/ha compared to the nil (Figure 3). In 2017 the response to cultivation was significantly greater (592-734kg/ha) across all cultivation treatments. The 2017 season had very dry winter conditions (Table 2) and the roots were visually stronger in the cultivation treatments.
Total dry matter cuts at harvest in 2018 indicate that nil cultivation had significantly lower biomass and tiller counts than the cultivation treatments (data not presented as still being analysed). NDVI measurements showed significant responses to cultivation by late August 2018 (data not presented). Winter rainfall in in 2018 was much better compared to 2017 with more soil moisture but September was dry which may have influenced the yield results (Table 2). Initial analysis indicates grain size was similar across all treatments in 2018.

Figure 3: GrainYield response to cultivation in 2017 and 2018 (lsd P=0.05). Note: the vertical axis does not begin at the origin to enable the lsd to be seen more clearly.
Table 2: Rainfall distribution in 2017 and 2018
2017 | 2018 | |
|---|---|---|
January-March | 92 | 95 |
April-July | 33 | 125 |
August -September | 78 | 65 |
Carbonate Amelioration Responses
In 2017 there was a significant response to amelioration with carbonate but only when cultivation was applied (P=0.002). The local carbonate sources were significantly better than where no ameliorant was applied but were generally not always significantly different to where limesand was applied (Figure 4). Soil tests, tissue tests and application of potassium at seeding ruled out this or other nutritional factors in the response. There were no treatment differences in 2018 (Figure 5).
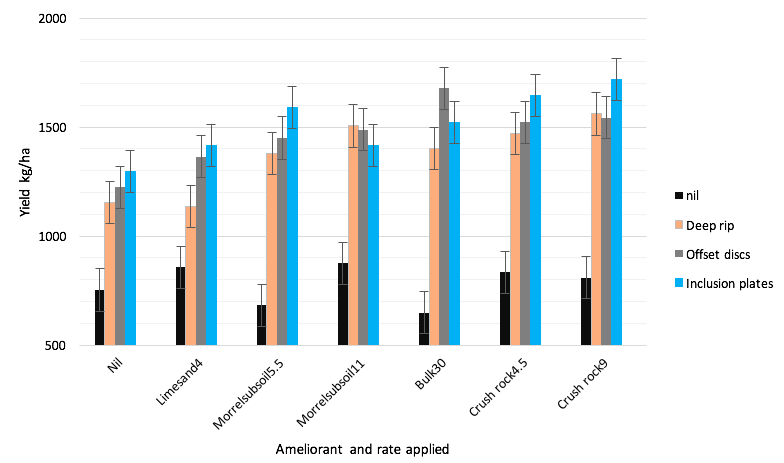
Figure 4: Grain yield response in 2017 to amelioration and cultivation. (Error bars show lsd P=0.05). Note: the vertical axis does not begin at the origin to enable the lsd to be seen more clearly.
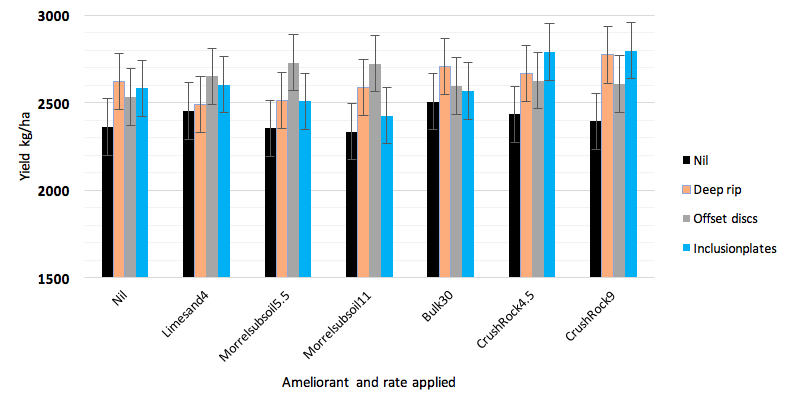
Figure 5: Grain yield response in 2018 to amelioration and cultivation.(Error bars show lsd P=0.05). Note: the vertical axis does not begin at the origin to enable the lsd to be seen more clearly.
Tissue test results
Tissue tests revealed that nutrients were adequate across all treatments in both 2017 and 2018. In 2017 the potassium concentration in the flag leaves in the late boot were 2-2.4% adequate range is > 1.6. In 2018 the potassium concentration in the youngest fully expanded leaves sampled at early stem elongation ranged between 2.7 and 3.0% with 2.4-4.0% being adequate (Reuter and Robinson 1986))
Soil pH results in 2018
All of the ameliorants, except the Crushed Rock applied at 4.5 t/ha, significantly raised the pH of the top 5 cm above the nil. The Morrel subsoil applied at 11 t/ha and the Bulk soil applied at 30 t/ha had significantly higher pH readings, down to 15 cm, than the nil, limesand and Crushed Rock applied at 4.5 and 9 t/ha (Figure 6).
The cultivation with offset discs averaged across all ameliorants showed a more even pH profile down to 15 cm with the top 5 cm being lower but the 10-15 cm depth being higher, which would be expected with the mixing of the ameliorants through the profile (Figure 7). The inclusion plate furrow also showed higher pH down the profile to 15 cm compared to samples taken from between the furrows. Crop and root growth was visually stronger in the inclusion furrows in both 2017 and 2018 than between the furrows, which would indicate that there was a better soil environment in the furrows. Aluminium (CaCl2), exchangeable aluminium, exchangeable calcium and organic matter are being analysed.
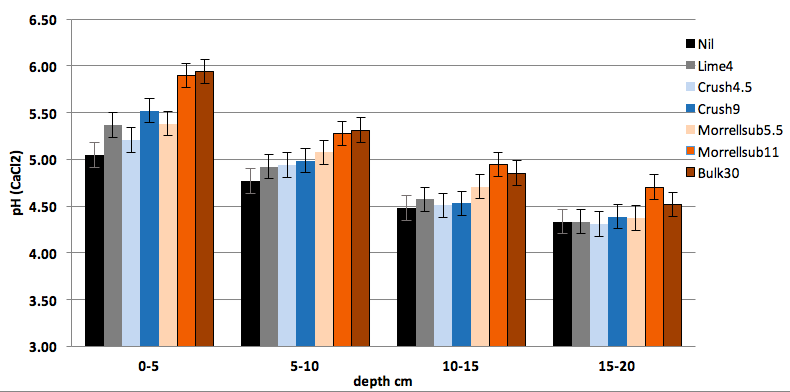
Figure 6: The pH profile in March 2018 for each ameliorant averaged across all cultivation treatments (Error bars show lsd P=0.05). Note: the vertical axis does not begin at the origin to enable the lsd to be seen more clearly.
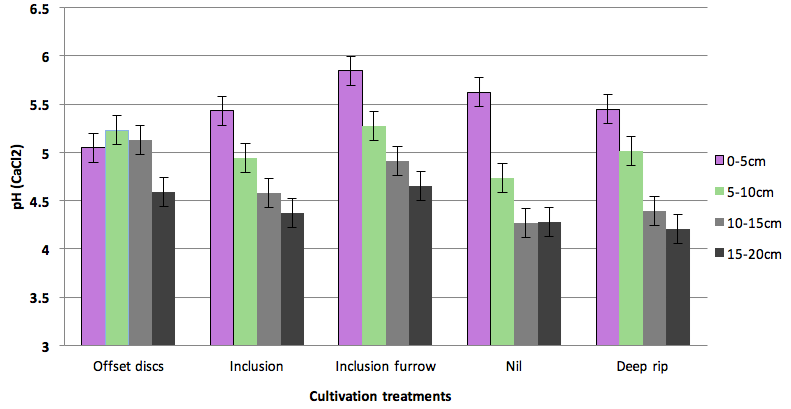
Figure 7: The pH profile in March 2018 for each cultivation treatment averaged across all ameliorant treatments (Error bars show lsd P=0.05). Note: the vertical axis does not begin at the origin to enable the lsd to be seen more clearly.
Local lime source survey
The local sources have a high percentage of very fine particles in the 0-0.075 mm range compared to limesand (Table 4). The highest neutralising value is always in the larger particles (+2.00 mm) and there is a larger percentage of particles in the >1 mm in these sources than limesand. The total NV was variable and lower than limesand.
Table 4: The wet sieve particle size distribution % for a range of eastern wheatbelt on-farm carbonate sources and limesand (highlighted in grey). The NV% for the very fine particle size (0-0.075 mm) and the coarse particle size(+2.00 mm) and total NV% are shown.
| Wet sieve particle size % | ||||||||
|---|---|---|---|---|---|---|---|---|---|
| +2.00mm | NV% | -2mm +1mm | -1mm +0.5mm | -0.5mm +0.25mm | -0.25mm +0.075mm | 0-0.075mm | NV% | Total NV% |
*1 | 12 | 82 | 21 | 15 | 12 | 12 | 19 | 63 | 72 |
*2 | 14 | 81 | 7 | 9 | 10 | 12 | 41 | 55 | 45 |
3 | 31 | 67 | 4 | 9 | 7 | 12 | 38 | 35 | 37 |
4 | 18 | 68 | 1 | 5 | 5 | 6 | 64 | 34 | 35 |
5 | 13 | 61 | 7 | 10 | 10 | 12 | 49 | 26 | 27 |
6 | 23 | 68 | 5 | 9 | 7 | 9 | 45 | 11 | 26 |
7 | 8 | 57 | 6 | 11 | 8 | 12 | 56 | 14 | 16 |
*8 | 4 | 55 | 10 | 19 | 9 | 4 | 41 | 16 | 13 |
9 | 5 | 62 | 5 | 8 | 7 | 8 | 66 | 9 | 12 |
Lime sand | 0 | 0 | 2.8 | 51.8 | 44.6 | 0.9 | 79.4 | 89 | |
*Kalannie trial sources
Conclusion
There were big yield responses to cultivation in 2017 but this effect was reduced in 2018, presumably due to the improved winter soil moisture conditions of 2018 followed by a dry September. Dry matter and NDVI measurements indicated a significant vegetative response to cultivation in 2017 and 2018. There was a significant yield response to local carbonate sources but only when cultivation was applied in 2017 but there was no yield response in 2018. In 2017 the local carbonate sources out yielded the nil treatment and performed as well as the limesand at all rates.
Cultivation with the offset discs inverted the soil so that pH was lower at 0-5 cm and higher at 10 – 15 cm than the other tillage treatments except for in the inclusion furrow. The inclusion furrows had significantly increased pH levels down to 15cm than between the furrows. Typically, it has been found that a deep cultivation on sandplain soils in the first year is beneficial when liming to alleviate subsoil compaction and to incorporate the lime (Davies et al 2014). Over two years on this site the shallow cultivation has yielded as well as the more expensive deep ripping options and produced better incorporation of the ameliorants in the top 15cm. It is hypothesized that local carbonate sources with large slaking particles may benefit from a good rainfall event before cultivation to ensure a better distribution of fine particles through the soil.
When averaged across all cultivation treatments, all carbonate ameliorants except Crushed Rock 4.5t/ha improved the pH in the top 5 cm compared to the nil. The pH profile down to 15 cm under the Bulk soil 30 t/ha and Morrell subsoil 11 t/ha treatments has improved significantly compared to limesand. Further intensive sampling is scheduled to confirm these results. The finer particle sizes with their increased surface area of these local sources would suggest that a faster reaction time could be expected, the need for which is most apparent in low rainfall amelioration (Conyers 2002). This rapid reaction may be due to the higher percentage of fine particle sizes making these ameliorants comparatively more effective at the higher rates than the 4t/ha limesand. The NSW calculator, which values fine particle size more highly, would indicate that the higher rates of the local Kalannie carbonate sources would be more effective at increasing soil pH than 4t/ha of limesand at least in the short term. A WA limesand source ground fine <0.095mm and applied at 2.5t/ha gave the same increase in soil pH as the unground limesand applied at 5t/ha over the 3 year period of the study, which concurred with the valuation of particles in the NSW calculator 2003 (Whitten,2001). Although it should be noted that this increase in efficiency does not necessarily mean that less lime will be required in the long-term, it indicates thatresponses and benefits can commence earlier by using a carbonate source that is finer. (Whitten 2001). The change in pH over a seven year time frame using different lime particle sizes shows that the fine particles result in a quicker pH change (data presented in Miller 2016). The local carbonate sources however have not been tested over a longer period of time and monitoring of the soil pH over time would be recommended. The choice of how to value the fine particles < 0.075 mm could be important to consider in the economics when comparing extracting a local source to bringing in lime from the more distant sources. Results from analyses done as part of the trial would indicate that the wet sieve analysis is a more accurate method of determining the percentage of these very fine particles in local carbonate sources that slake or disperse.
The local carbonate sources are highly variable in their neutralising value and have a very different particle size distribution to that of limesand. It is going to be important to understand how to find sources that are good quality with high neutralising value and fine particle sizes. This can be a challenge given that the local lime source survey indicated that the highest NV was associated with the coarse particles >2 mm. The Kalannie Morrel subsoil product once the rocks were screened out has 40% of the product < 0.075 mm and this faction has a NV of 55%, and so is a relatively high-quality product.
In 2019 it is planned to sow canola at the site. Canola is more sensitive to soil acidity and toxic aluminium and it is also a valuable crop to be able to include in a sandplain rotation. More rapid amelioration of soil acidity would be highly beneficial so as to allow for the inclusion of canola in the rotation.
References
Azam,G., Gazey, C., Bowles, R. and D’Antuono, M. (2019) Combined application of lime and gypsum boosts grain yield in acidic soil. GRDC Research update paper.
Conyers, M.K. (2002). Liming and Lime Materials IN Encyclopedia of soil science / edited by Rattan Lal, Marcel Dekker
Davies, S., Gazey, C., Parker, W., Blackwell, P. and Riethmuller, G., Wilkins, A., Negus, P.,Hollins, T., Gartner, D., and Lefroy, W. (2014) Lime incorporation into acidic subsoils – assessing cost, efficacy, value and novel approaches
Gazey, R., Oliver, Y.,Fisher, J., Andrew,J.,and Carr, S. (2013) 20 years of soil acidity RD and E in Western Australia – What have we learnt.
Hunt, N & Gilkes, B (1992) Farm monitoring handbook, The University of Western Australia, Nedlands
Miller, L. (2106). Local lime results and what you need to consider in buying and applying lime. GRDC research update paper.
Reuter, D.J.,and Robinson, J.B. (1986) Plant Analysis An Interpretation Manual 1986, Inkata Press Melbourne and Sydney.
Scott, B.J., Conyers, M.K., Fisher, R. and Lill, W. (1992). Particle size determines the efficiency of calcitic limestone in amending acidic soil. Aust. J. Agric. Res., 1992, 43, 1175-1185.
Van Gool, D. (2016) Identifying soil constraints that limit wheat yield in south-west Western Australia. Resource Management Technical Report 399. Department of Agriculture and Food Western Australia.
Whitten, M. (2001). Comparing size in lime. J. of the Department of Agriculture, WA, series 4, Vol 42, article 4
Acknowledgements
We thank the Nixon family at Kalannie for their ongoing support, encouragement and commitment to this trial.
Shari Dougal and DPIRD RSU staff, and DPIRD staff David Hall, Glen Riethmuller, Grantley Stainer and David Dodge for assisting with the trial.
Stacey Hansch and Jenni Clausen DPIRD for their collaboration, GRDC Project Number DAW00256
GRDC Project Number: DAW00242
Paper reviewed by
Dr James Fisher, Désirée Futures
GRDC Project Code: DAW00242,
Was this page helpful?
YOUR FEEDBACK
