Irrigate or not to irrigate? - profitability is the question
Author: Damian Jones (Irrigated Cropping Council) | Date: 25 Jul 2019
Take home messages
- When making decisions on spring irrigations, water price (temporary as well as any allocation / carryover), grain price and crop potential are the key factors to consider.
- Gross margin tools can be used to determine the minimum yield required to give a return on water invested and to estimate financial returns to assist in decision making such as whether irrigating wheat can be profitable in drought years.
- Assessment of crop potential is essential to determine if the minimum yield required is achievable. Tiller numbers/m2 can be multiplied by 0.013 to estimate yield/ha.
- Don’t discount hay rather than grain as an option.
Background
In dry seasons the volume of water available is reduced, resulting in irrigators having to make decisions on whether grain, hay or water trading will be the more profitable option. Irrigators need to weigh up the price of water against the potential return of the crop and compare this with the cost of sacrificing crop yield and the potential income from selling water.
The key drivers for the decision to irrigate in the spring are the cost of water, grain price and estimated crop potential. Gross margin tools can be used to forecast the most profitable use of the irrigation water however, the value of the gross margin is only as reliable as the information used in its calculation. Being able to accurately assess whether a crop’s potential yield is enough for a profitable outcome is essential.
Methods
A harvest survey of irrigated wheat crops from the Murray and Murrumbidgee Valleys was conducted during 2018, a season which was very dry in this area (Table 1). The survey assessed total biomass, grain yield and head numbers as well as recording agronomic inputs such as fertilisers and irrigation water.
Table 1. Growing season rainfall (mm) Apr-Oct for areas within the Murray and Murrumbidgee Valleys
Location | 2018 Growing season rainfall (mm) | Average GSR rainfall (mm) |
|---|---|---|
Blighty | 150 | 253 |
Coleambally | 108 | 252 |
Conargo | 117 | 233 |
Deniliquin | 116 | 255 |
Goolgowi | 124 | 226 |
Kerang | 120 | 232 |
Moulamein | 85 | 223 |
Results and discussion
The three factors that determine the profitability of irrigation are:
- Yield potential
- Commodity price
- Price of water
Once you have accurate data on these three factors, you are in a position to calculate a gross margin to determine the profitability of either using water (via allocation or purchasing the required volume) to produce a crop or trading the water as a source of income.
Yield potential
Having the ability to assess the crop’s potential prior to irrigation is key to making the right decision. A recent survey of irrigated wheat crops across the Murray and Murrumbidgee Valleys conducted by the Irrigated Cropping Council with the support of the GRDC, sought to determine the cost:benefit of irrigating wheat in drought conditions (GRDC Project ICF1810-001 WCX). The survey assessed a range of irrigation setups, strategies, fertiliser inputs and yields. Crop harvest samples were taken to determine total crop biomass, grain yield and head numbers. This data was then analysed to produce some ‘rules of thumb’ to determine potential yield when assessing crops at late stem elongation. At this timing, the crop is still developing the head, and therefore, yield potential. Moisture stress during late booting will result in death of the florets in the head, significantly reducing yield potential. It is therefore important to have the ability to determine potential yield at this time to determine the profitability of irrigating. Although the ‘rules of thumb’ are applicable in most years, during drought and when the water price is relatively high, the timing of the first irrigation carries greater risk.
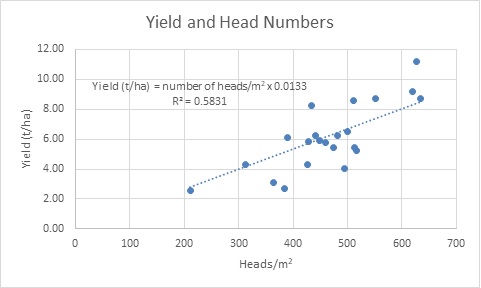
Figure 1. Relationship between wheat head numbers and final grain yield, data taken from the 2018 Harvest survey
There is a firm relationship between head numbers and yield (Figure 1). Yield can be estimated based on head numbers by multiplying the number of tillers (head numbers) per square metre by 0.0133. Another way of looking at this relationship is that the crops averaged 1.33 t/ha per 100 heads/m2.
E.g. If the wheat crop at booting has 500 tillers/m2, then the estimated yield is 500 x 0.0133 = 6.65 t/ha.
Crops varied in performance and as a general observation, those that achieved greater than 1.33t/ha per 100 heads/m2 were supplied with enough moisture to ensure grain fill and sufficient nitrogen to match the yield. Those that failed to achieve 1.33t/ha per 100 heads/m2 were crops that had suffered a setback which impacted on yield. Setbacks included late sowing, insufficient nitrogen, moisture stress (as a result of no pre-irrigation or pre-irrigation with no spring irrigation) and crop damage as a result of frost or lodging.
A key factor in 2019 will be whether the crop was established and developed with adequate moisture (pre-irrigation and/or good winter rainfall) or struggled with limited in-crop rainfall. From the survey in 2018, the crops that were not irrigated prior to sowing and then irrigated in the spring, averaged 1.07 t/ha per 100 heads/m2, ranging from 0.82 to 1.38. The benefit of pre-irrigation is demonstrated in the photographs taken at the ICC Trial Block on June 21st. The trials were sown on April 30th, with similar paddock rotation, seeding and fertiliser rates.
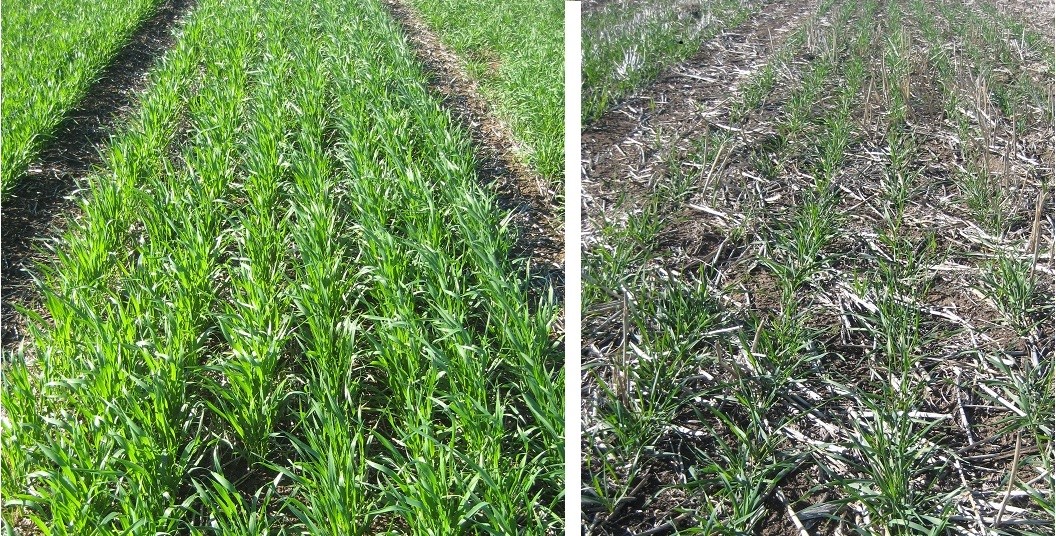
Photo. Wheat trial June 21st. Pre-irrigation LHS – 800 kg DM/ha, no pre-irrigation RHS, 160 kg DM/ha.
A key driver in obtaining yield is biomass (Figure 2).
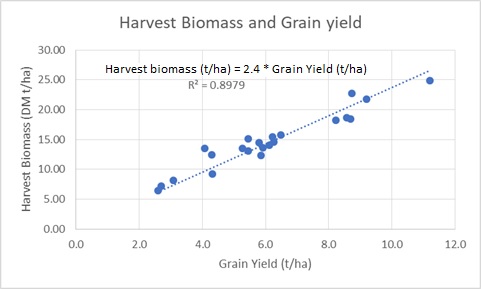
Figure 2. Relationship between wheat yield and total crop biomass, data taken from the 2018 Harvest Survey
The relationship between grain yield and total harvest biomass is demonstrated in Figure 2. Given the samples were cut at ground level and care was taken to minimise losses, it does confirm the rule of thumb that the hay yield of a wheat crop is approximately double that of grain.
In drought years, a reasonable option for an irrigated crop could be the hay market. Irrigation at the booting stage results in rapid growth in biomass. Previous work by the ICC has seen biomass double in the period from booting (Z49) to early grain development (Z72) in cereals. This may make hay an option as an attractive end use for the crop, as one spring irrigation is usually enough to get the crop sufficiently mature for cutting for hay, as demonstrated by the successful ‘bulk crop’ of oaten hay at the ICC Trial Block in 2018 (Figure 3). It is important however to use gross margin calculations to help determine if this option is the most profitable.
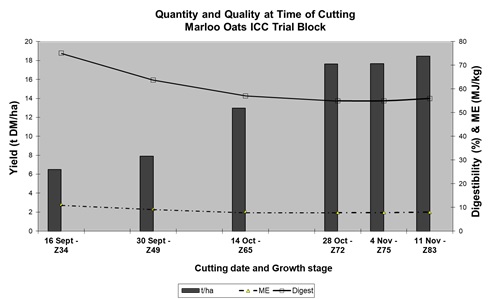
Figure 3. Dry matter and crop growth stage. ICC oat trial 2005.
Commodity price
Gross margin calculations rely on having the most accurate information on what the anticipated grain prices will be at delivery. In 2018 grain prices began to trend upwards during the growing season as dryland areas experienced poor winter rains and demand remained strong from the livestock industries. Prices rose approximately $100/t from sowing but remained variable - falling as each rainfall event was forecast and then rose as the rain failed to eventuate. However, the grain prices in late August when irrigation decisions needed to be made were similar to the eventual harvest prices, and therefore, proved to be a reasonably accurate use in the gross margin calculations.
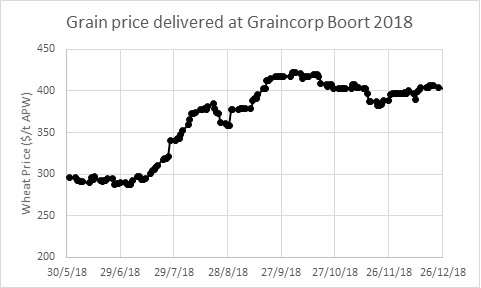
Figure 4. Australian prime wheat (APW) price ($/t) delivered at Graincorp Boort during August 2018 (Source: Graincorp).
Price of water
The price used for water in the gross margin calculations will vary depending on whether it is allocation, carryover, purchased or opportunity cost. There are many arguments as to what is the ‘right’ value to use, but whatever value you choose, make sure it is right for your individual case as it impacts on the acceptable financial return for using irrigation water.
At the time of this analysis, the temporary price of water was trading at approximately $340/Ml (ranging from $320-375/Ml) during the 2018 spring irrigation period, with allocations in Victorian Murray high-reliability water shares (HRWS) 59%, Goulburn HRWS 47%, NSW Murray general security at 0% and Murrumbidgee general security at 6% in mid-August.
Gross margins
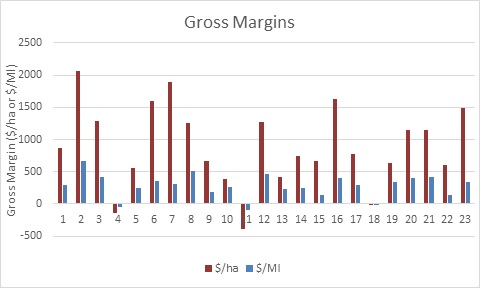
Figure 5. Wheat gross margins from crops included in the 2018 Harvest Survey
Gross Margins were calculated based on the following assumptions:
- Yield, water used and fertiliser data were relevant to the surveyed paddock.
- Input costs such as seed, herbicide and machinery operations were considered similar between all irrigators and estimated to be $255/ha.
- Water price of $340/Ml (the price of temporary transfer water at the time). This was an imputed cost and not the actual cost to the irrigator (e. g. water via allocation is approximately $60/Ml to Victorian irrigators).
- Wheat valued at $400/t, irrespective of delivery point or quality.
- Additional income from straw or agistment was not considered.
Despite the dry conditions, irrigated wheat was profitable in all but three cases and for the top 10% of growers irrigated wheat produced gross margins of over $1,500/ha. In comparison, gross margins of selling water and producing hay were estimated at $560/ha and $2080/ha, respectively.
Conclusion
To make the decision on whether to irrigate or not, the crop needs to be inspected to ensure it has the potential to meet the minimum yield for profitable investment of irrigation water. Irrigators can make realistic yield estimates based on tiller numbers/m2 and the multiplication factor of 0.013 prior to the spring irrigations. A gross margin tool, along with estimates of commodity prices and variable costs (particularly price of water), can be used to assess the return required to make a profitable return on investment.
Once the decision is made to irrigate, the need to be timely becomes even more important to ensure the crop is not stressed and the potential yield and return is not jeopardised. Ensuring nutrients are adequate to meet the potential yield prior to irrigation is also essential.
Irrigated crops can generate large biomass if they receive adequate irrigation and nutrition. An alternative to taking grain crops through to harvest is to commit them to hay production.
Contact Damian Jones for your gross margin tool.
Useful resources
The Cost: Benefit of Irrigating Wheat under Drought Conditions (GRDC Factsheet to be published)
Gross Margin calculator – ‘Irrigate or Not’ ICC spreadsheet. Contact Damian Jones for a copy
Irrigated Cropping Gross Margin calculator - NSW DPI
Acknowledgements
The research undertaken as part of this project is made possible by the significant contributions of growers through both trial cooperation and the support of the GRDC, the author would like to thank them for their continued support.
The Irrigated Cropping Council and GRDC would like to thank the irrigated grain growers that participated in this project.
Contact details
Damian Jones
PO Box 549 Kerang 3579
0409 181 099
damian.jones@irrigatedcroppingcouncil.com.au
@Canola_Boy
GRDC Project Code: ICF1810-001 WCX,
Was this page helpful?
YOUR FEEDBACK