Hyperspectral sensing for the prediction of nitrogen, water and salt content in wheat
Take home messages
- Hyperspectral methods can be used as alternatives to traditional laboratory methods to quantify biochemical plant properties.
- Hyperspectral methods were used to predict and visualise nitrogen (N) and water levels in wheat as well as to distinguish between salt-treated and control plants.
- These non-destructive methods can be used to quantify biochemical parameters of crops throughout the season in a timely and spatially explicit manner.
Background
Quantifying biochemical and physiological parameters of crops can be key to achieving optimal yield. However, traditional laboratory methods are destructive, costly and time-consuming. Hyperspectral methods have the potential to be used as a rapid, precise and non-destructive alternative for monitoring plant traits.
Hyperspectral instruments acquire spectral reflectance information in many narrow, spectrally contiguous bands throughout the visible (VIS), near-infrared (NIR) and shortwave infrared (SWIR) regions of the electromagnetic spectrum (350-2500nm). In the case of vegetation, the properties of this reflectance data are mainly determined by biochemical compounds of leaf tissue and the morphology and structure of the leaf surface. Therefore, hyperspectral reflectance data can provide information on a number of biochemical or physiological plant properties. Compared to other optical techniques, hyperspectral methods have the vast and superior advantage in that they can provide layered trait information within the same spectral region.
This research utilised hyperspectral methods, both imaging and non-imaging techniques, to quantify the N content, water content and salt status of wheat plants in a high-throughput manner.
Method
Greenhouse experiments were carried out in an automated phenotyping platform at The Plant Accelerator (Australian Plant Phenomics Facility, University of Adelaide, Adelaide). The platform houses a hyperspectral imaging chamber which contains two individual cameras, a Specim FX10 (Specim, Oulu, Finland) operating in the visible and near infrared (VNIR: 400-1000nm) range and Specim SWIR operating at the longer shortwave infrared (SWIR: 1300-2500nm) wavelengths. Wheat plants were subjected to various levels of soil N (25 or 100mg/kg), watering conditions (10 or 20% g/g gravimetric water content), and salt treatment (100mM NaCl, control). Two hyperspectral images of each plant were collected using the two cameras operating in different wavelength ranges. The spectral data was extracted from each image and combined to give reflectance throughout the 400-2500nm range.
In addition to the hyperspectral cameras, non-imaging reflectance data (350-2500nm) was also collected for the plants in the salt experiment using a handheld non-imaging spectrometer equipped with a plant probe fore-optic and a leaf clip holder (ASD FieldSpec 3, Analytic Spectral Devices, Boulder, USA).
Due to the large amount of data provided by the hyperspectral instruments, spectral pre-processing was required to achieve accurate predictions of N, water and salt content. Pre-processing of the data involved smoothing, wavelength selection and derivatives to reduce noise and improve subsequent calibration models. Partial Least Squares Regression (PLSR) was used to develop the prediction models alongside reference measurements of N, water and salt obtained using traditional laboratory techniques.
Results and discussion
Nitrogen and water content
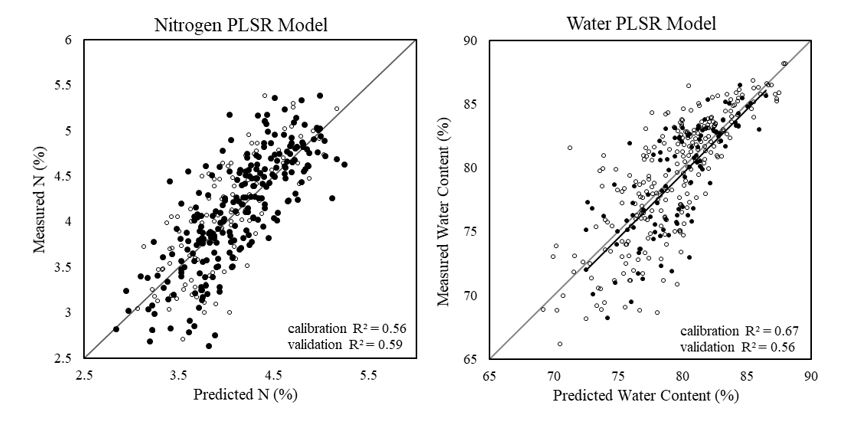
Both plant water content and N level could be predicted with ‘acceptable’ accuracy using hyperspectral images and PLSR modelling (Figure 1). The average N content of the plant was predicted with a slightly higher accuracy than water level (validation R2 = 0.59 and R2 = 0.56, respectively). The resultant model parameters were used to develop distribution maps, which enabled changes in the content and spatial distribution of N and water content to be visualised at the pixel level of wheat plants.
Figure 1. Measured versus predicted N content (%) (left) and water content (%) (right) using hyperspectral imagery and PLSR modelling.
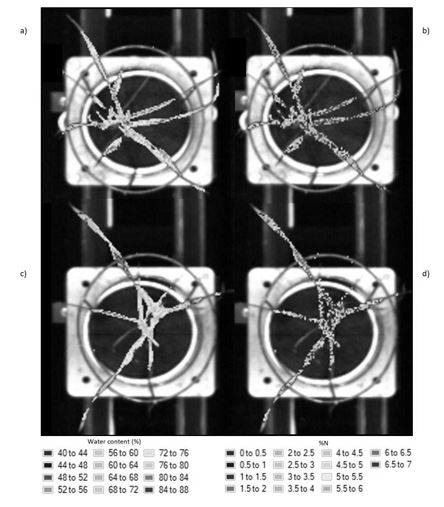
The resulting prediction maps revealed the spatial variation in biochemical properties, particularly water content, and allowed for a visual comparison between and within the plants that is otherwise impossible with the raw hyperspectral data (Figure 2). There were noticeable differences between the maps of the watered (Figure 2a) and drought plants (Figure 2c). In general, water content appeared higher at the base of the leaves and decreased towards the tips. Higher levels of water were also apparent around the midrib region as opposed to the outsides of the leaves. The N distribution maps (Figures 2b and 2d) do not appear to follow a plausible spatial pattern; each pixel is a different colour with no clear gradation to the neighbouring pixels. This ‘noise’ in the image is likely the result of model overfitting.
Figure 2. Distribution maps showing the prediction of water content in a watered (a) and drought (c) plant and N levels in a low (b) and high (d) N soil plant. Coloured version available from first author upon request.
Salt content
An absolute value for salt ion content could not be accurately predicted using hyperspectral methods. Prediction likely failed due to the small range of values obtained for potassium (K)+ and sodium (Na)+ in the leaves caused by the experimental treatment applied (only one level of 100mM NaCl added to half of the pots). A larger range in applied salt treatments and resulting salt concentrations in the leaf tissue, would improve the strength of the prediction model.
However, hyperspectral methods were successful in distinguishing salt-treated and control plants based on their spectral signatures. A support vector machine (SVM) algorithm was able to classify salt-treated and control plants with 97.5% accuracy using point spectra from single leaves and 100% accuracy using average plant spectra obtained from the hyperspectral images. An artificial neural network (ANN) algorithm was also able to distinguish between the image spectra of salt-treated and control plants with 100% accuracy. Spectra derived from the whole-plant images consistently gave better results than leaf-level spectra suggesting that whole-plant analysis is more indicative of salt status than single leaf measurements.
Table 1. Classification accuracies of different methods for their ability to classify plants as either control or salt-treated based on their spectral signatures (n= number of samples in validation set).
Field spectrometer, single leaves | Camera images, whole plant | |||||
|---|---|---|---|---|---|---|
SVM | Predicted Control | Predicted Salt | SVM | Predicted Control | Predicted Salt | |
Reference Control | 40 | 1 | Reference Control | 28 | 0 | |
Reference Salt | 1 | 38 | Reference Salt | 0 | 39 | |
n=80, Accuracy=97.5% | n=67, Accuracy=100% | |||||
DT | Predicted Control | Predicted Salt | DT | Predicted Control | Predicted Salt | |
|---|---|---|---|---|---|---|
Reference Control | 19 | 22 | Reference Control | 24 | 4 | |
Reference Salt | 5 | 34 | Reference Salt | 3 | 36 | |
n=80, Accuracy=66.3% | n=67, Accuracy=89.6% | |||||
Naïve Bayes | Predicted Control | Predicted Salt | Naïve Bayes | Predicted Control | Predicted Salt | |
|---|---|---|---|---|---|---|
Reference Control | 26 | 15 | Reference Control | 24 | 4 | |
Reference Salt | 6 | 33 | Reference Salt | 6 | 33 | |
n=80, Accuracy=73.8% | n=67, Accuracy=85.1% | |||||
ANN | Predicted Control | Predicted Salt | ANN | Predicted Control | Predicted Salt | |
|---|---|---|---|---|---|---|
Reference Control | 24 | 8 | Reference Control | 28 | 0 | |
Reference Salt | 17 | 31 | Reference Salt | 0 | 39 | |
n=80, Accuracy=68.8% | n=67, Accuracy=100% | |||||
Conclusion
Quantifying biochemical and physiological parameters of crops is crucial for achieving optimal yield. Traditional analysis methods are destructive, costly and time-consuming. Hyperspectral methods are emerging as rapid, accurate and non-destructive alternatives. This work utilised hyperspectral data collected in a high-throughput manner to quantify N level, water content and salt status in wheat. Both non-imaging and imaging instruments were used to acquire spectral information at different plant scales under greenhouse environments. Water and N content could be predicted and visualised using hyperspectral methods while salt-treated plants could successfully be distinguished from control plants. Results suggest that with appropriate data collection, pre-processing and analysis, hyperspectral techniques have significant potential for quantifying and monitoring wheat biochemical attributes which are otherwise impossible or unfeasible with traditional methods.
Acknowledgements
The research undertaken as part of this project is made possible by the significant contribution of growers through the support of the GRDC, the author would like to thank them for their continued support. The author would also like to thank all staff at The Plant Accelerator® for their research support. Stuart Roy and Jodie Kretschmer are thanked for their assistance with the salt experiment and flame photometry measurements. The financial support provided by the Grains Development and Research Corporation, Tim Healey Memorial Scholarship (Primary Industries and Regions South Australia) and The Plant Accelerator (Australian Plant Phenomics Facility) is gratefully acknowledged.
Useful resources
Australian Plant Phenomics Facility Website
APPF Factsheet - Hyperspectral imaging and analysis
Contact details
Mrs Brooke Bruning
The Plant Accelerator, The University of Adelaide, Waite Campus
(08) 83130824
brooke.bruning@adelaide.edu.au
@AustPlantPhenom
GRDC Project Code: UOA1801-001RSX,
Was this page helpful?
YOUR FEEDBACK


