Overcoming key agronomic constraints to faba bean production in the Victorian high rainfall zone
Author: James Manson, Gina Kreeck and Jon Midwood (Southern Farming Systems), Jason Brand and Joshua Fanning (Agriculture Victoria Research, Horsham) and Ross Ballard (SARDI, Adelaide) | Date: 25 Feb 2020
Take home messages
- Acid-tolerant strains of Group F rhizobia increased the nodulation of faba beans on acidic soils (pH<5.0 CaCl2) with low background rhizobia at Chatsworth and Rokewood, Victoria, but optimal nodulation rates were not achieved.
- After a late break, with adequate chemical fungal disease control, PBA Samira faba bean grain yields at Tarrington, Victoria, increased as targeted plant density was increased from five to 45 plants/m2. However, the gross margin only increased from five to 35 plants/m2.
- Genetic resistance and fungicides increased disease control and yield of faba beans, in a high disease-pressure year at Tarrington in 2019, however more than just disease control contributed to grain yield.
- PBA Amberley is more resistant to chocolate spot than PBA Samira and PBA Zahra, but still benefitted from chemical fungal control at Tarrington in 2019.
Background
In Victoria, faba bean plays a supporting role to canola as a break crop. From 2014 to 2019, 386, 000 hectares were sown to canola, compared with the 95, 000 hectares sown to faba bean (ABARES 2019). Nevertheless, the contribution of faba bean to farming systems is expected to increase with continued improvement in from agronomy and breeding. Growing pulses such as faba beans provides benefits to farming systems that are not available with canola alone. Benefits include a potential reduction in nitrogen (N) inputs in crops following the nitrogen-fixing legume, an extra pest and disease break in canola-cereal systems, and the opportunity for a double-break from cereals to control problem weeds such as annual ryegrass.
Several constraints to faba bean production in the Victorian high rainfall zone (HRZ) limit its incorporation into farming systems. Two key agronomic constraints are considered in this paper; poor nodulation in acid soils and disease pressure in humid crop canopies. Addressing these constraints would increase faba bean profitability and potentially contribute to their increased adoption in the region.
Faba bean and their associated Group F rhizobia are more susceptible to soil acidity than canola (Burns 2018), a particular challenge for the Victorian HRZ. A recent report showed that of 100 paddocks surveyed, 62% had a soil pH (CaCl2) of less than 5.0 in the 0-10cm layer, and 52% of sites were less than 4.8 in the 10-20cm layer (Debney 2019). Acid-tolerant rhizobia strains have been identified in response to this challenge (Ballard et al. 2018).
Faba bean are suited to the HRZ as the most waterlogging-tolerant pulse species of those grown in Victoria, however, they are also susceptible to foliar fungal disease (GrowNotes 2017), which is prevalent in the moist canopies. It is known that higher crop plant densities increase the risk of fungal disease by increasing canopy humidity, especially in early-sown crops. This has been factored into the recommended sowing rates, targeting 20 plants/m2 with early sowing and up to 30 plants/m2 for later sowing (GrowNotes 2017). Little work has been done, however, to test these recommendations since 2011. Since that time, several varieties have been released with longer growing seasons and greater disease resistance to key fungal diseases like chocolate spot (for example; PBA Samira and PBA Zahra). In older recommendations, mid-April is considered a very early sowing date (GrowNotes 2017). More recently, many growers begin sowing faba bean in the first week of April. New fungicide products are also available. It is unknown whether the recommendations for faba bean canopy management should be adjusted to reflect these changes.
Method
Acid-tolerant rhizobia for increased nodulation in acid soils
Two acid-tolerant rhizobia strains (SRDI969 and SRDI970) and the commercially available strain WSM1455 were cultivated and supplied by South Australian Research and Development Institute (SARDI), Adelaide, as peat. These were made into a peat slurry by grower hosts and applied to faba bean seed at the standard rate, then sown on the same day with a commercial seeder at 130 kg seed/ha. Two replicates of each treatment were sown in the following order; no inoculant, commercial strain, SRDI969, SRDI970. A third strip with no inoculant was sown at the end to check for cross-contamination between treatments.
The trial at Chatsworth was sown on 13 May 2019 into moist soil, whereas the trial at Rokewood was sown on 26 April 2019, about one week before a significant rain event. The soil pH of each site is presented below in Table 1. At eight weeks after crop emergence, ten plants were collected along each strip and the nodules were counted on the intact root systems.
Table 1. Soil pH of on-farm inoculation trials at two sites in Victoria in 2019.
Site | pH CaCl2 | |
|---|---|---|
0-10cm | 10-20cm | |
Rokewood, Victoria | 4.51 | 4.77 |
Chatsworth, Victoria | 4.98 | 4.63 |
Canopy management to optimise yield potential
Two small-plot trials were sown at a research site in Tarrington to test canopy management; one testing the effect of time of sowing (TOS) and sowing rate on yield, and the other testing cultivar choice and fungicide program on disease control and yield.
The trial that tested TOS and sowing rate was set up as a random complete block design with a split-plot factorial treatment structure and eight replicates organised in four TOS blocks. It was sown with PBA SamiraA on 26 April and 16 May 2019. These treatments emerged by 20 May and 4 June 2019, respectively, over three weeks after the sowing date, due to the late start to the season. Sowing rates were calculated based on the grain size, the germination rate and an estimated establishment rate of 85% (Table 2). The fungicide program that was applied to all treatments is presented in Table 3.
Table 2. Sowing rates used for target plant densities.
Grain size (g/100 seeds) | Germination rate (%) | Establishment rate (%) | Target plant density (plants/m2) | Sowing rate (kg/ha) |
|---|---|---|---|---|
66 | 95 | 85 | 5 | 41 |
15 | 124 | |||
25 | 206 | |||
35 | 289 | |||
45 | 371 |
Table 3. Fungicides applied to a sowing date x plant density faba bean trial at Tarrington, Victoria in 2019.
Date applied | Product | Rate/ha | Active ingredient rate/ha |
|---|---|---|---|
30 July 2019 | Veritas® | 1L | Tebuconazole 200g Azoxystrobin 120g |
3 September 2019 | Mancozeb 750 ® Carbendazim 500 | 1kg 500mL | Mancozeb 750g Carbendazim 250 mL |
26 September 2019 | Aviator Xpro® A | 600mL | Prothioconazole 90g Bixafen 45g |
A This application of Bixafen + Prothioconazole was off label for experimental purposes only.
For this trial, the gross margin (GM) was calculated based on the PIRSA 2019 Gross margin guide. The price of sowing seed was changed to $1.70/kg of seed and the cost of sowing was calculated for each sowing rate treatment. The yield data for each plot was used to calculate freight cost and End Point Royalties ($3.85/t yield for PBA Samira). Yield components were examined by collecting 15 branches per plot then counting the number of pods per tiller before removing the seeds and weighing grain biomass.
The trial that tested variety and fungicide program was set up as a random complete block design experiment with four replicates and a split-plot factorial treatment structure. This included six cultivars and four fungicide programs, where treatments were blocked by fungicide program. It was sown on 26 April and emerged by 20 May 2019 due to a late start to the season. Varieties used and their resistance rating to foliar fungal disease are presented in Table 4. Fungicide programs are outlined in Table 5. Visual disease scores were done in October and November, assessing chocolate spot incidence as a percent of leaf area affected per plot.
Table 4. Varieties and their resistance to Aschochyta blight and chocolate spot used in a variety x fungicide faba bean trial at Tarrington, Victoria in 2019 (Fanning et al. 2019).
Variety | Aschochyta blight | Chocolate spot (Botrytis) | |
|---|---|---|---|
Pathotype 1 | Pathotype 2 | ||
PBA Amberley | RMR | RMR | MR |
PBA Zahra | R | MRMS | MS |
PBA Samira | RMR | RMR | MS |
PBA Rana | R | MRMS | MS |
PBA Marne | RMR | MRMS | S |
PBA Bendoc | RMR | RMR | S |
Key; R = resistant, MR = moderately resistant, RMR = resistant-moderately resistant, MRMS = moderately resistant – moderately susceptible, MS = moderately susceptible, S = susceptible.
Table 5. Fungicide treatments in a variety x fungicide faba bean trial at Tarrington, Victoria in 2019. Table 6 provides the trade name and rate of chemicals applied for each treatment where the rates were the same across treatments.
Growth stage | Early flower only | Old chemistry only | District practice | Complete controlA | Date |
|---|---|---|---|---|---|
5 node | Mancozeb @2.2 kg/ha | Carbendazim B | Disease free A | 30-Jul | |
Early flower | Bixafen + Prothioconazole | Mancozeb @2.2 kg/ha | Mancozeb @1kg/ha + Carbendazim | 3-Sep | |
Mid flower | Mancozeb @1kg/ha + Chlorothalonil | 17-Sep | |||
Mid pod | Mancozeb @2.2 kg/ha | Mancozeb @1kg/ha + Chlorothalonil | 30-Oct |
A The complete control treatment is a rotation of fungicides applied to ensure minimal to no disease as a control in the experiment.
B Carbendazim is currently permitted for application on beans under a temporary permit (PER13752).
Table 6. The active ingredients, trade names and rate of chemicals used in a variety x fungicide faba bean trial at Tarrington, Victoria in 2019.
Active Ingredient | Trade name of chemical used | Rate (mL/ha) |
|---|---|---|
Carbendazim | Carbendazim 500 | 500 |
Bixafen + Prothioconazole | Aviator® Xpro® | 600 |
Mancozeb | Mancozeb 750 | Rates vary, see Table 5 |
Chlorothalonil | Chlorothalonil 720 | 1400 |
Results and discussion
Acid-tolerant rhizobia for increased nodulation in acid soils
Acid-tolerant rhizobia increased nodulation in on-farm trials at both Chatsworth and Rokewood in 2019 (Table 7). The low nodulation rate in Nil control treatments shows that there was little to no background rhizobia in these acidic paddocks, where a legume had not been sown for several years. Slightly more nodulation was seen in the nil control check plots, (where a strip was sown with un-inoculated seed after the other treatments were sown), compared to the Nil control treatments. This suggests that there was minimal cross-contamination between treatments.
At Chatsworth, there were 10-15 more nodules per plant in acid-tolerant rhizobia treatments compared to the commercial strain treatment. This was also two to three times greater than the grower’s paddock, where seed was inoculated with peat slurry at the standard rate (albeit from a different source to the commercial strain treatment used in the trial). However, the nodulation rate of 37 to 43 nodules per plant in the acid-tolerant treatments is still below what is considered optimal nodulation (50 nodules/plant).
At Rokewood the average level of nodulation was much lower than Chatsworth. This could be partly due to the earlier sowing date in very dry soil, the seed treatment with Thiram and Thiabendazole (P-Pickel T) fungicide (which is known to affect nodulation), and/or the greater level of waterlogging in this paddock during May. Regardless, acid-tolerant rhizobia slightly increased nodulation over the commercial strain treatment. The grower’s paddock however, had much greater nodulation. This grower inoculated the seed with a standard rate of peat slurry inoculant and sowed with a standard rate of granular inoculant, which would increase the number of rhizobia bacteria present in the soil during bean root growth. The purpose of using acid-tolerant rhizobia in acidic soils is also to increase the number of rhizobia bacteria, but it appears that in the harsher conditions of the Rokewood paddock, doubling the rate inoculant achieved this end to a greater extent than the acid-tolerance trait.
These on-farm trials demonstrate that acid-tolerant rhizobia can improve nodulation in acid soils (pH<5.0 CaCl2) with low background rhizobia levels under differing environmental conditions. However, these strains did not achieve optimal nodulation rates by themselves. Appropriate liming programs to control soil acidity, targeting a pH of > 5.5, are also importantalong with using higher inoculation rates.
Table 7. Nodulation from on-farm demonstrations testing faba bean rhizobia strains.
Chatsworth (pH 4.8 CaCl2) | Rokewood (pH 4.6 CaCl2) | |||
|---|---|---|---|---|
Nodules/plant | s.e. (n=10) | Nodules/plant | s.e. (n=10) | |
Nil control | 0.4 | 0.3 | 0.9 | 0.6 |
Commercial strain | 28.5 | 4.3 | 5.3 | 1.0 |
Acid-tolerant strain 1 | 37.4 | 4.1 | 8.3 | 2.0 |
Acid-tolerant strain 2 | 43.3 | 5.1 | 11.3 | 1.7 |
Nil control check | 12.5 | 2.8 | 4.2 | 1.5 |
Grower practice | 14.7 | 4.1 | 29.9 | 4.5 |
Canopy management to optimise yield potential
Effect of time of sowing and plant density on yield
In the TOS x plant density trial, faba bean establishment was slightly greater than the targeted plant densities. However, consistent and significant differences were achieved between sowing rate treatments (Table 8). Emergence date and plant density affected canopy structure. Due to the late break in the 2019 season, emergence date is presented rather than sowing date, to more accurately reflect the growing season at this site. Earlier emerged treatments were significantly taller, as were higher plant densities, but later emerging treatments reached a plateau in crop height from 25 plants/m2. The height to the lowest pod was increased from 20cm above the soil surface to 35cm from the lowest to the highest plant density. Treatments with lower plant densities compensated for the reduction in plant number by setting more grain-filled pods, containing a larger grain biomass per tiller.
Data shows that changing the plant density and emergence date can create substantial changes to the canopy structure of faba bean. Changes to plant height and structure were more pronounced with earlier emergence date, but changes to grain yield components (per branch) were only affected by plant density. Although not observed in this trial year, earlier sowing with high plant densities may increase the risk of lodging in some seasons.
Table 8. Effect of establishment date and plant density on crop canopy structure and yield components of faba bean grown at Tarrington, Victoria in 2019.
Crop est. (plants/m2) | Crop height (cm) | Height to first pod (cm) | Grain-filled pods per tiller | Grain biomass (g) per tiller | ||||||||
|---|---|---|---|---|---|---|---|---|---|---|---|---|
Emergence date (E) | ||||||||||||
20-May-19 | 31.1 | - | 111.0 | a | 27.4 | - | 9.6 | - | 14.6 | - | ||
4-Jun-19 | 30.8 | - | 101.6 | b | 27.5 | - | 9.4 | - | 13.8 | - | ||
Lsd (P<0.05) | 2.3 | 3.3 | ns | ns | ns | |||||||
P-value (E) | 0.777 | <0.001 | 0.901 | 0.353 | 0.056 | |||||||
Target plant density (D) | ||||||||||||
5 plants/m2 | 9.6 | e | 88.6 | e | 20.1 | e | 12.7 | a | 18.4 | a | ||
15 plants/m2 | 19.0 | d | 100.6 | d | 24.0 | d | 10.5 | b | 15.3 | b | ||
25 plants/m2 | 32.1 | c | 107.1 | c | 26.9 | c | 9.4 | c | 14.1 | b | ||
35 plants/m2 | 42.9 | b | 115.3 | b | 30.8 | b | 8.0 | d | 12.0 | c | ||
45 plants/m2 | 51.1 | a | 119.6 | a | 35.3 | a | 7.2 | d | 11.0 | c | ||
Lsd (P<0.05) | 3.9 | 3.8 | 2.8 | ns | ns | |||||||
P-value (D) | <0.001 | <0.001 | <0.001 | 0.353 | 0.056 | |||||||
Emergence date x Density (ExD) | ||||||||||||
20 May | 5 pl/m2 | 9.2 | - | 89.1 | f | 19.6 | - | 12.4 | - | 18.6 | - | |
15 pl/m2 | 18.3 | - | 103.9 | d | 22.5 | - | 10.5 | - | 15.4 | - | ||
25 pl/m2 | 34.7 | - | 113.1 | c | 28.0 | - | 9.4 | - | 14.5 | - | ||
35 pl/m2 | 41.8 | - | 120.8 | b | 30.3 | - | 8.3 | - | 12.3 | - | ||
45 pl/m2 | 51.5 | - | 127.9 | a | 36.4 | - | 7.7 | - | 12.0 | - | ||
4 June | 5 pl/m2 | 10 | - | 88.1 | f | 20.6 | - | 13.0 | - | 18.3 | - | |
15 pl/m2 | 19.7 | - | 97.3 | e | 25.6 | - | 10.5 | - | 15.2 | - | ||
25 pl/m2 | 29.4 | - | 101.1 | de | 25.9 | - | 9.3 | - | 13.7 | - | ||
35 pl/m2 | 44.1 | - | 109.9 | c | 31.4 | - | 7.8 | - | 11.7 | - | ||
45 pl/m2 | 50.8 | - | 111.3 | c | 34.1 | - | 6.7 | - | 10.1 | - | ||
Lsd (P<0.05) | ns | 5.4 | ns | ns | ns | |||||||
P-value (ExD) | 0.322 | 0.002 | 0.267 | 0.473 | 0.680 | |||||||
Even though treatments with lower plant numbers had greater grain biomass per tiller, plant density increased yield from 5 to 45 plants/m2 (Figure 1). This suggests that plant density has a greater effect on yield than the ability of faba bean (cv. PBA SamiraA) to adjust pod number and grain biomass per plant. This was true in 2019 for both emergence dates.
It is possible that in a different season with earlier emergence dates, the gains to yield from higher plant density would be overshadowed by the yield penalty from fungal disease, especially in very early-emerging crops. Therefore, these results should not be taken to mean that very high plant densities are recommended in all situations. Rather, these results demonstrate that with reasonable genetic resistance to fungal disease, alongside an adequate fungicide program, the yield potential of faba bean is much greater than what can be achieved with a standard sowing rate. In the situation where the autumn break is delayed, the sowing rate can be increased substantially and managed accordingly. It should be noted that these trials were sown at 20cm row spacing after burning stubble residues and this may affect extrapolation to specific on-farm situations.
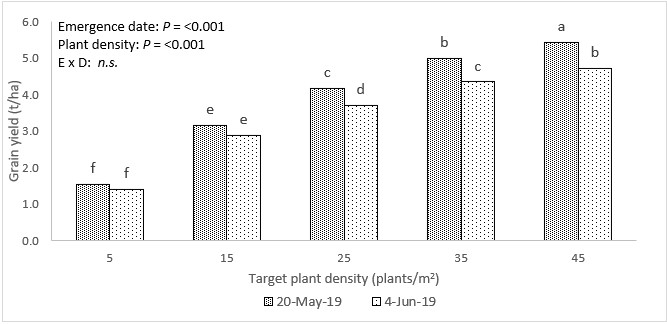
Figure 1. Effect of emergence date and plant density on faba bean yield at Tarrington, Victoria. Different letters indicate the difference between means is greater than the ExD Lsd value (P<0.05).
Figure 2 illustrates that while yield increased from 5 to 45 plants/m2, gross margin (GM) did not. Rather, for both emergence dates, the GM increased up to 35 plants/m2 and then remained constant. In this trial the same fungicide program was applied to all plant densities, maintaining the cost of fungicide between treatments. Change in GM in this case is being driven by the extra cost of seed at sowing ($1.70/kg seed) and the extra yield ($500/t) gained from higher plant densities. While the increase in yield from 35 to 45 plants/m2 was significant, it did not outweigh the extra cost in seed, resulting in comparable gross margins. Therefore, the economic threshold for target plant density was lower than the yield threshold but is still much greater than typical target plant densities of 15 plants/m2. To summarise, if there is a late break, and a variety with genetic resistance comparable to PBA Samira is used with adequate fungicide control, sowing rates can be increased substantially from a GM point of view. Conclusions were not sensitive to sowing seed cost ($0.90/kg vs. $1.70/kg) or grain price ($400/t vs $500/t vs $600/t), however may be sensitive to changes in fungicide costs, which was not explored.
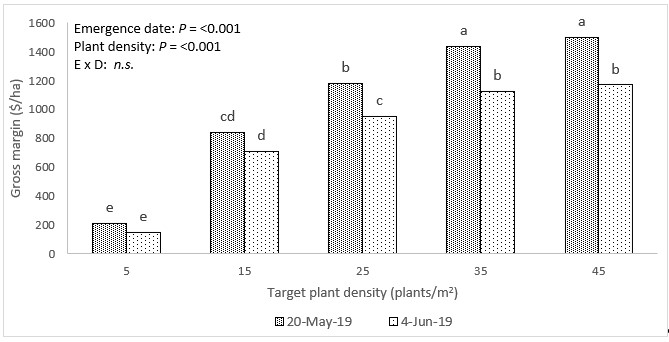
Figure 2. Effect of emergence date and plant density on faba bean gross margin at Tarrington, VIC (sowing seed cost: $1.70/kg; grain price: $500/t). Different letters indicate the difference between means is greater than the ExD Lsd value (P<0.05).
Higher sowing rates also involve higher risk, one source being the greater upfront cost of sowing seed. The breakeven yield, or yield required to cover variable costs, is presented in Table 9 for four grain prices. The long-term average grain price for faba bean is $500/t, and at this price the breakeven yield ranges from 1.1 t/ha to 2.4 t/ha for crop densities of 5 to 45 plants/m2. Therefore, the higher the sowing rate, the more dependent enterprise becomes on favourable environmental conditions.
Table 9. Breakeven yield (t/ha, yield required to cover variable costs) of faba bean grown at five plant densities at Tarrington, VIC in 2019 (sowing seed cost; $1.70/kg).
Breakeven yield (t/ha) | ||||
|---|---|---|---|---|
Grain price ($/t) | 300 | 400 | 500 | 600 |
5 plants/m2 | 1.8 | 1.4 | 1.1 | 0.9 |
15 plants/m2 | 2.5 | 1.8 | 1.5 | 1.2 |
25 plants/m2 | 3.0 | 2.2 | 1.8 | 1.5 |
35 plants/m2 | 3.5 | 2.6 | 2.1 | 1.8 |
45 plants/m2 | 4.0 | 3.0 | 2.4 | 2.0 |
Disease risk is another source of increased risk with high plant densities. 2019 was a high disease-pressure year at the Tarrington research site, however the fungicide program used in the plant density trial minimised foliar fungal disease (Table 3). The role of disease control in this season was explored a neighbouring trial testing varieties and fungicide programs for disease control and yield.
Effect of variety and fungicide program on foliar fungal disease and yield
At Tarrington in 2019, variety and fungicide program affected chocolate spot incidence and yield (Table 10). The effect of fungicide on chocolate spot differed by variety (VxF P = <0.001), but the effect of fungicide on yield was consistent across varieties (VxF P = 0.623). This indicates that yield was less correlated to disease control than chocolate spot symptoms.
Three applications of mancozeb had the most severe disease symptoms among the treatments tested and this older chemistry should not be relied upon to control chocolate spot. Adding carbendazim or chlorothalonil to mancozeb, ‘district practice’, significantly increased fungal disease control.
Interestingly, a single application of Aviator Xpro® at early flowering (‘Early flower only’ treatment) significantly reduced chocolate spot incidence compared to three applications of Mancozeb (‘Old chemistry’ treatment). This suggests that the early flowering spray timing was an important application in this season. Although it received an extra application compared to ‘Old chemistry’, the large reduction in chocolate spot symptoms by ‘District practice’ suggests that the other active ingredients in this program are providing most of the benefit.
The Complete control treatment, which used multiple fungicide applications to achieve the greatest extent of disease control in the experiment, increased yield by 1 t/ha compared to the least effective program, ‘Early flower spray only’. Furthermore, the importance of disease control to yield in 2019 is underscored by the fact that the ranking of fungicide programs by yield is the reverse order to the ranking of treatments by chocolate spot incidence.
The contribution of genetic resistance to chocolate spot was also demonstrated in this experiment. Ranking varieties by chocolate spot incidence matches their resistance ranking (compare Tables 4 and 10). Yield was again inversely related to chocolate spot incidence for these treatments as well.
The significant interaction of varieties and fungicide programs (VxF P = <0.001) for chocolate spot control shows the interplay of these factors. Varieties with high genetic resistance, such as PBA Amberley, responded to increased fungicide intensity but to a lesser degree than a more susceptible variety such as PBA Marne. The incidence of chocolate spot in PBA Amberley with an ‘early flower only’ spray was 6% of plot leaf area, decreasing to 4% under the Complete Control program. In comparison, PBA Marne changed from 35 to 25% for the same fungicide treatments. Genetic resistance reduced, but did not negate, the reliance of the crop on fungicides to control chocolate spot. PBA Amberley is more resistant to chocolate spot than PBA Samira or PBA Zahra, but it still benefitted from chemical disease control.
By contrast, there was no interaction between fungicide program and variety for yield. Every variety increased in yield by about 1t/ha, from the worst fungicide program (old chemistry only) to the best fungicide program (Complete Control program). This shows that a range of genetic and environmental factors were affecting yield other than disease control. These factors lie outside the scope of this experiment.
Table 10. Effect of variety and fungicide program on chocolate spot incidence and grain yield of faba beans grown at Tarrington, VIC in 2019.
Chocolate spot (late spring) (% of plot leaf area affected) | Grain yield (t/ha) | |||||
|---|---|---|---|---|---|---|
Variety (V) | ||||||
PBA Amberley | 6 | e | 4.6 | a | ||
PBA Zahra | 13 | d | 4.4 | a | ||
PBA Samira | 12 | d | 3.5 | b | ||
PBA Rana | 27 | c | 3.4 | b | ||
PBA Marne | 34 | b | 2.5 | c | ||
PBA Bendoc | 38 | a | 2.4 | c | ||
Lsd (P<0.05) | 3 | 0.2 | ||||
P-value (V) | <0.001 | <0.001 | ||||
Fungicide program (F) | ||||||
Complete control | 15 | c | 4.0 | a | ||
District practice | 18 | bc | 3.6 | b | ||
Early flower spray only | 23 | b | 3.0 | c | ||
Old chemistry only | 34 | a | 3.0 | c | ||
Lsd (P<0.05) | 7 | 0.3 | ||||
P-value (F) | <0.001 | <0.001 | ||||
Variety x Fungicide (VxF) | ||||||
Amberley | Complete control | 4 | k | 5.0 | - | |
District | 4 | jk | 4.6 | - | ||
Early flower x1 | 6 | ijk | 4.2 | - | ||
Old chemistry | 11 | hi | 4.1 | - | ||
Zahra | Complete control | 8 | ijk | 5.1 | - | |
District | 13 | hi | 4.5 | - | ||
Early flower x1 | 11 | hij | 3.7 | - | ||
Old chemistry | 21 | fg | 3.9 | - | ||
Samira | Complete control | 9 | ijk | 4.1 | - | |
District | 11 | hi | 3.4 | - | ||
Early flower x1 | 13 | hi | 3.0 | - | ||
Old chemistry | 20 | fg | 3.2 | - | ||
Rana | Complete control | 16 | gh | 3.9 | - | |
District | 21 | fg | 3.6 | - | ||
Early flower x1 | 31 | cd | 3.1 | - | ||
Old chemistry | 40 | b | 2.9 | - | ||
Marne | Complete control | 25 | def | 2.8 | - | |
District | 25 | def | 2.7 | - | ||
Early flower x1 | 35 | bc | 2.2 | - | ||
Old chemistry | 58 | a | 2.3 | - | ||
Bendoc | Complete control | 29 | cde | 2.9 | - | |
District | 34 | bc | 2.5 | - | ||
Early flower x1 | 40 | b | 2.1 | - | ||
Old chemistry | 55 | a | 1.9 | - | ||
Lsd (P<0.05) | 6 | ns | ||||
P-value (VxF) | <0.001 | 0.623 | ||||
Conclusion
A robust fungicide program can significantly reduce foliar fungal disease in faba bean but a variety with a resistance rating of at least MS was required to maintain chocolate spot disease at low levels (<10% leaf area) in 2019. The greatest level of disease control was achieved with PBA AmberleyA (MR) under fungicide programs that were as intense, or more intense, than a standard fungicide program in the region. Yields responded consistently to both variety and fungicide program, led by PBA Amberley, PBA Zahra and PBA Samira.
Plant densities of 5 to 45 plants/m2 in PBA Samira that emerged on 20 May or 4 June increased yield with each increase in plant density, however gross margin only increased up to 35 plants/m2. The fungicide program in this experiment was comparable to the most effective programs in the disease trial mentioned above. The experiments were on the same research site, suggesting that fungicides played an important role in maintaining the yield potential of these higher plant densities. High sowing rates are associated with a greater financial risk due to greater up-front costs in sowing seed and a higher agronomic risk of disease. In a situation where the autumn break is late, using a variety with a resistance rating of at least MS for chocolate spot and application of an adequate fungicide program, it may be economical to increase plant densities well above the typical 15-20 plants/m2 to maximise the yield potential. This will depend on the level of risk the business is comfortable with.
Finally, new acid-tolerant rhizobia strains were demonstrated to increase faba bean nodulation compared to a commercially available strain on acid soils (pH CaCl2<5.0) with low background rhizobia. However, they did not increase nodulation to the optimal level of 50 nodules/plant by themselves. Proactive liming programs and high inoculant rates remain important ways to achieve sufficient nodulation in faba bean on acid soils.
Acknowledgements
The research undertaken as part of this project is made possible by the significant contributions of growers through both trial cooperation and the support of the GRDC, the author would like to thank them for their continued support.
Useful resources
GRDC GrowNotes South: Faba beans, 2017
GRDC_LEGUMES IN ACIDIC SOILS: MAXIMISING PRODUCTION POTENTIAL, 2018
References
Agriculture.gov.au/abares_ Australian Crop Report Victoria
Ballard R, Farquharson E, Ryder M, Denton M, Henry F, Whitworth R, Haskins B, Yates R (2018) Pulse rhizobia performance on acid soils. GRDC_Pulse Rhizobia Performance On Acid Soils
Burns H (2018) Growing legumes in acidic soils: Maximising production potential in South-eastern Australia
GRDC_LEGUMES IN ACIDIC SOILS: MAXIMISING PRODUCTION POTENTIAL, 2018
Debney A (2019) Insights into the health of soils in the Glenelg Hopkins Catchment Management Authority. Internal report.
Fanning, J, Brand J, Sigel L (2019) Pulse Disease Guide 2019. agriculture.vic/Pulse-disease-guide-victoria-2019.pdf
PIRSA (2019) Farm Gross Margin and Enterprise Planning Guide.
Contact details
James Manson
23 High Street, Inverleigh VIC 3321
0488 600 509
jmanson@sfs.org.au
@trialsofJManson
GRDC Project Code: DAV1706-003RMX,
Was this page helpful?
YOUR FEEDBACK