Stem elongation frost damage in cereals in southern New South Wales
Author: Malcolm D, Brill R, Petty H and Maccallum R (NSW Department of Primary Industries), Reeves K (Curtin Uni/ SAGI WEST) and Biddulph B (WA Department of Primary Industries and Regional Development). | Date: 18 Feb 2020
Take home messages
- All cereals (wheat, barley, oats) displayed the ability to recover from extreme frost events at stem elongation through re-tillering.
- Match phenology to sowing dates to begin flowering when the frost risk has passed is critical to yield formation.
- However, stem elongation exposure to frost is also important to yield development.
- Urambie barley was consistently higher yielding than all other varieties from all sowing windows.
- Sowing fast varieties (LaTrobe, Emu Rock, Scepter) later increased yields compared to early sowing.
- Oat varieties benefitted from later sowings through increases in both yield and grain quality
Background
Frost damage in the early stages of stem elongation has been a major constraint for cereal grain production in recent seasons in southern New South Wales (NSW), particularly during 2014, 2017 and 2018. In frost prone areas it is common practice to match phenology with sowing date to ensure flowering begins after the major frost risk period, whilst still aiming to not flower too late to avoid water and heat stress during grain fill.
Although heading and flowering are considered the time when plants are most susceptible to frost damage (Frederiks et al., 2015), damage can occur at any time, but more severe temperature conditions are required. Cereal crops are also susceptible to death of the meristem from stem elongation onwards (growth stage (GS)31). This is the commencement of the stage where the growing tip is carried above ground level as the stem elongates. Observations from the 2014 season indicated that severe frosts at the stem elongation stage can result in damage to the stem internodes and/or death of the growing point resulting in subsequent death of the main stem and tillers, with grain yield losses observed.
Traditionally, barley and oats are considered more frost tolerant then wheat, however this comparison has most often been made for frosts around anthesis. The different phenological traits, overall plant characteristics and locality of where these species are grown in the landscape often makes it hard to compare between the species.
Mixed species (wheat, barley and oats) sowing dates experiments were conducted in a frost prone environment near Wagga Wagga NSW in 2017 and 2018 to determine the response of different cereal species to severe frosts, especially during early reproductive growth stages.
Method
For the experiments in 2017 and 2018, wheat, barley and oat varieties were assessed across four sowing windows in frost prone landscapes near Wagga Wagga, NSW. The four times of sowing (kept consistent for both years) were: 11 April (mid-April), 20 April (late-April), 4 May (early-May) and 25 May (late-May).
Table 1. Maturity-type of wheat, barley and oat cultivars used in the sowing date by crop-type trial at Wagga Wagga, NSW in 2017 and 2018.
Phenology Type | Wheat | Barley | Oats |
|---|---|---|---|
Early | Emu Rock | La Trobe | Durack |
Mid | Scepter | Mitika | |
Mid-long | LRPB Trojan | Commander | Bannister |
Long (mild Photoperiod) | Cutlass | ||
Long (strong Photoperiod) | LRPB Eaglehawk | ||
Winter | LRPB Kittyhawk | Urambie |
Varieties which perform well across southern Australia production systems were selected to represent the different phenology classes within each crop type (Table 1). Within each sowing window, a restricted randomisation approach was used with varieties of three crop types (oats, wheat and barley), randomised to crop type blocks in a randomised lattice. Each sowing window comprised three replicates and each sowing window was considered a separate environment not a treatment per se.
To monitor the differences in crop canopy effects on frost severity and duration, unshielded air temperature was measured at canopy height with Tiny Tag Plus 2 (TGP-4017) loggers with internal temperature probes. Loggers were installed north facing with the internal temperature sensors facing upwards. Temperature was logged every 15 minutes between the start of stem elongation (GS31) and crop maturity (GS87) in a reference variety in each of the three species (wheat – cv. Scepter; barley – cv. La Trobe; oats – cv. Bannister) in all three replicates in each sowing treatment. Temperature sensors were installed when the earliest maturing treatment was at GS31 and increased in height in 100mm increments fortnightly as the canopy grew to maintain +/- 100mm of the canopy boundary layer/flag leaf height. Loggers were cable tied to a white, 50mm diameter, 1200mm high polyvinyl chloride pipe in the middle of the plot.
Reference air temperature was measured with a Stevenson screen by a weather station located at the experiment site.
The experiment was monitored to determine key crop development stages and was machine harvested at maturity with edge rows removed.
Results and discussion
Seasonal conditions
The 2017 growing season in southern NSW experienced an above average number of extreme frost events. At the Wagga Wagga site, there were 103 recorded frost events from the unshielded temperature loggers at canopy height, with 87 of these recording temperatures below -2.0°C. The coldest temperature recorded at canopy height was -9.6°C on 1 July (Figure 1). Slightly less severe conditions were observed in 2018 at Wagga Wagga; 101 frost events were recorded with the unshielded temperature loggers at canopy height, with 65 below -2.0°C, the lowest recorded on 28 August at -10.5°C (Figure 1). Screen temperatures on average measured two degrees warmer than those at crop canopy height (Figure 1), emphasising the fact that the canopy experiences colder temperatures than those measured by weather stations as previously reported by Frederikset al. (2012).
Historical weather data (Source: Australian CliMate) indicates that the occurrence of frost events are becoming more prevalent, with nine severe frost events (screen temperatures) below -3°C occurring in the last five years through August and September compared to the long term average of 0.4 times per year. Temperatures of below -3°C have occurred in 10 of the last 39 years, with half of these being in the last 10 years.
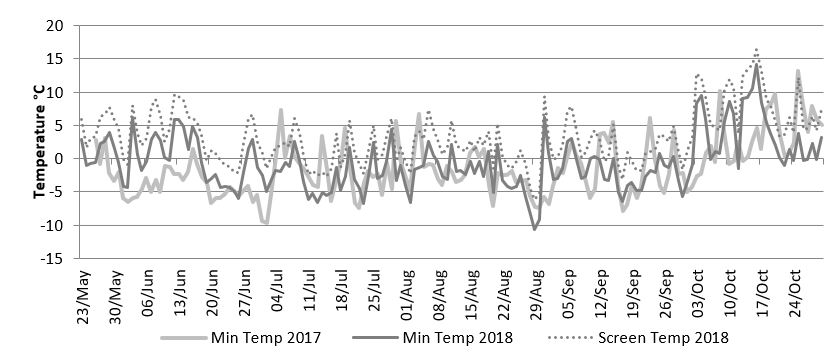
Figure 1. Minimum daily air temperature at canopy boundary layer during 2017 and 2018 growing seasons compared to Stevenson’s screen air temperature at Wagga Wagga, NSW.
In 2017, on average, the canopy at Wagga Wagga was exposed to 819 hours below 0°C for the mid-April sowing, 658 hours below 0°C for the late-April sowing, 439 hours for the early-May sowing and 289 hours below 0°C for the late-May sowing. Duration of frost events was shorter in 2018, with the mid-April sown crop exposed to on average 660 hours below 0°C, the late-April sowing 620 hours, the early-May sowing 505 hours and the late-May sowing exposed to 271 hours below 0°C.
The growing season rainfall (April to October) at Wagga Wagga was 199mm for 2017 and 138mm in 2018, well below the average of 321mm. There was above average rainfall in 2017 for the month of October, with 64mm at Wagga Wagga.
Phenology
For the first three sowing dates at Wagga Wagga in 2017 (mid-April to early-May), there were 31 to 36 days difference in time from sowing to GS31 between the fast spring types and winter types in both wheat and barley. For example, from the mid-April sowing, Emu Rock reached GS31 on 12 June, whilst LRPB Kittyhawk reached GS31 on 13 July in 2017. However, in the later May sowing date, this reduced to only 13 days between the earliest (La Trobe) and the winter wheat LRPB Kittyhawk. Slightly larger gaps were seen in 2018 with 42 to 54 days difference in GS31 between the fast springs and winter type barleys and wheats in the mid- and late-April sowing dates. The barleys were closer in the early- and late-May sowing dates with 26 to 29 days difference between LaTrobe and Urambie. The early-May wheats had 50 days difference between Emu Rock and LRBP Kittyhawk, the late-May sowing date having 35 days difference. The number and severity of frosts experienced resulted in all varieties, regardless of phenology type, being exposed to frost during stem elongation. The faster developing varieties were exposed to a greater number of frost events after the start of stem elongation (Figure 2).
Varieties compensated for the stem elongation damage by initiating new tillers. These tillers often contributed to most of the grain yield, especially from the earlier sowing dates. The process of tiller death from stem elongation frost and subsequent regrowth meant that the time for each plot to reach growth stages beyond GS31 was longer than typical. As effected tillers were dying, their development slowed then ceased. Until tillers showed obvious signs of senescence (yellowing) it was difficult to establish how badly they had been affected by frost without detailed dissections. Consequently, crop growth stage continued to be recorded on effected tillers, resulting in slowing or stagnation of development scores. When later-developing or regrowth tillers caught up to and overtook the dying tillers, scores for crop growth stages increased. This delay and increased spread in apparent phenological development of the crop meant capturing representative heading (GS49) and flowering (GS65) dates proved challenging and were likely misleading. Consequently, those data are not discussed in detail here.
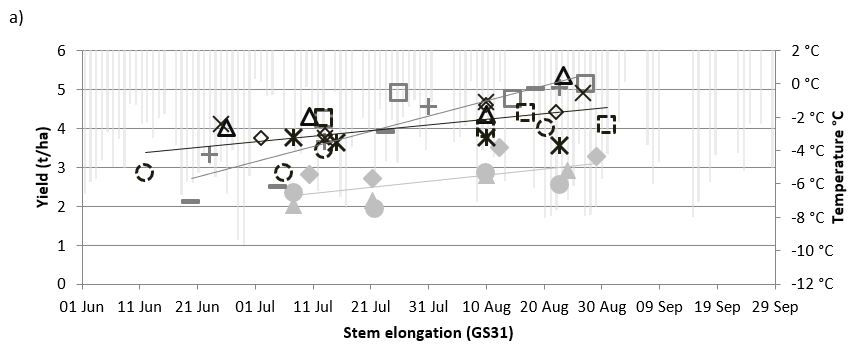
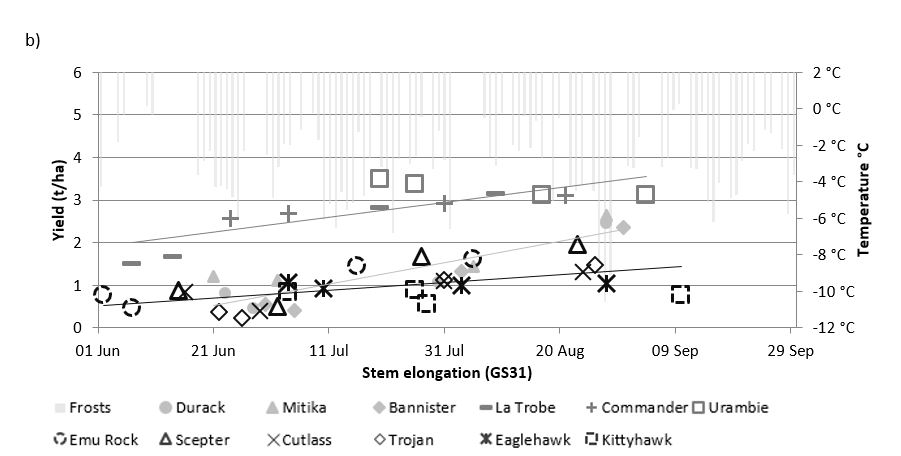
Figure 2. The relationship between timing of the start of stem elongation (GS 31) and grain yield (t/ha) for the three cereal species grown in the experiment at Wagga Wagga in 2017 (a) and 2018 (b). The light grey bars show the occurrence and severity of frost events measured at canopy height with un-shielded Tiny Tag (TGP-4017). The four consecutive symbols of the same variety from left to right represent the sowing windows from mid-April to late-May.
Yield
For all species and in both seasons, grain yield increased as stem elongation was delayed (Figure 2). Oats yielded consistently lower than wheat and barley in all sowing windows at Wagga Wagga in 2017 and were generally penalised from early stem elongation. Wheat performed better than barley when the start of stem elongation was mid-June to mid-July, with barley yielding slightly more than wheat where stem elongation was delayed until late-July. In 2018, barley was consistently higher yielding than wheat and oats from all sowing dates. Oats were comparable to wheat when stem elongation started before August, however yielded on average 1.1t/ha higher than wheat where stem elongation started late-August to early-September. (Figure 2).
Due to the winter varieties requirement for vernalisation (LRPB Kittyhawk wheat and Urambie barley), stem elongation was delayed. They were able to avoid some of the severe frost events, potentially avoiding stem frost damage which caused them to have a more stable yield for all sowing windows, yielding between 4t/ha and 5t/ha in 2017.
Very fast developing varieties such as La Trobe barley and Emu Rock wheat benefitted from later sowing dates which delayed the start of stem elongation and flowering, resulting in higher yields. This is likely as a result of reduced exposure to frost events at critical growth stages and their ability to mature before severe terminal stress.
The slowest maturing oat (Bannister) had the highest oat yield at all sowing times. Overall, the trend of increased yield was related to matching sowing date and varietal phenology. Sowing much earlier than recommended (for varieties to flower in the optimum flowering window - early to mid-October for the Wagga Wagga region) was penalised due to stem elongation frost. Sowing slightly later than recommended escaped late heat and drought in 2017 due to the slightly above-average rainfall in October.
Economic analysis
In 2017, the highest gross incomes came from mid-maturity varieties sown late-May, with Scepter achieving the highest gross income from the wheats ($1,526/ha) and Commander the highest of the barleys with $1,309/ha (Table 2). In the early-April sowing window in 2017, the longer-season varieties generated the highest gross income with LRPB Kittyhawk wheat achieving a gross income of $1,154/ha and Urambie barley $942/ha. This was assumed to be due to a combination of reaching stem elongation later than the spring varieties (thereby having less stem frost damage) and converting the October rain into higher yields (rather than through improved grain quality and higher classification). Due to low deliver prices and lower yields in 2017, the oat varieties had the lowest gross incomes. Higher yields were achieved in 2017 due to the October rainfall producing regrowth tillers on many varieties even with some varieties being downgraded due to poorer grain quality.
The drier conditions throughout the 2018 season resulted in reduced yields which had a direct effect on gross incomes. The early- and late-May sowings had the early- and mid-season varieties producing higher gross incomes, with Scepter having the highest gross income from the late-May sowing ($880/ha). The long-season varieties managed slightly better gross incomes when sown mid-April then when sown later, however the drier conditions and resulting lower yields and downgrades in quality meant these gross incomes were still not as high as those achieved by the early- and mid-season varieties sown late. Urambie barley was consistently higher yielding then the other barleys across all sowing windows, although it still achieved higher gross incomes from the mid- and late-April sowing windows compared with early- and late-May sowing windows. La Trobe and Commander both had higher gross incomes when sown late-May compared with their other sowing dates, with all barleys having the same gross income of $1,194/ha when sown late-May. In 2018, due to not meeting minimum grain receival standards, the oats were not able to obtain a commercial value until the late-May sowing window, where better grain quality and higher yields meant Durack and Mitika were able to achieve gross incomes of $840 and $910/ha, respectively. (Table 2)
Table 2. Gross incomes ($/ha) of wheat, barley and oat varieties grown in the experiment at Wagga Wagga in 2017 and 2018. Grain prices for 2017 based on local grain delivery prices, prices for 2018 based on the closest Port prices.
2017 | |||||||||
|---|---|---|---|---|---|---|---|---|---|
mid-April | late-April | early-May | late-May | ||||||
Wheat | Emu Rock | H2 | 811 | H1 | 846 | H2 | 978 | H1 | 1192 |
Scepter | APW | 1087 | APW | 1167 | APW | 1182 | H2 | 1526 | |
Trojan | APW | 1015 | APW | 1039 | APW | 1245 | APW | 1199 | |
Cutlass | APW | 1116 | APW | 1018 | APW | 1266 | APW | 1328 | |
LRPB Eaglehawk | ASW | 932 | H2 | 806 | APW | 1022 | APH2 | 1081 | |
LRPB Kittyhawk | APW | 1154 | H2 | 1129 | H2 | 1249 | H2 | 1161 | |
Barley | LaTrobe | Malt FAQ | 495 | Feed 1 | 555 | Malt 1 | 1009 | Feed 1 | 1116 |
Commander | Malt 1 | 866 | Malt 1 | 936 | Malt 1 | 1182 | Malt 1 | 1309 | |
Urambie | Feed 1 | 943 | Feed 1 | 1093 | Feed 1 | 1058 | Feed 1 | 1142 | |
Oats | Durack | Milling 1 | 422 | Milling 1 | 346 | Milling 1 | 515 | Feed | 380 |
Mitika | Milling 1 | 365 | Milling 1 | 386 | Milling 1 | 501 | Milling 2 | 481 | |
Bannister | Feed | 420 | Feed | 407 | Feed | 525 | Milling 1 | 588 | |
2018 | |||||||||
mid-April | late-April | early-May | late-May | ||||||
Wheat | Emu Rock | AUH2 | 352 | AUH2 | 176 | AUH2 | 616 | Feed1 | 600 |
Scepter | Feed1 | 338 | Feed1 | 188 | Feed1 | 638 | AUH2 | 880 | |
Trojan | Feed1 | 150 | Feed1 | 75 | Feed1 | 413 | Feed1 | 563 | |
Cutlass | Auh2 | 352 | AUH2 | 176 | Auh2 | 484 | AUH2 | 572 | |
LRPB Eaglehawk | Feed1 | 413 | AUH2 | 396 | Feed1 | 375 | Feed1 | 375 | |
LRPB Kittyhawk | AUH2 | 396 | AUH2 | 264 | Feed1 | 300 | Feed1 | 300 | |
Barley | LaTrobe | Feed1 | 578 | Malt1 | 616 | Malt2 | 1,078 | Feed1 | 1,194 |
Commander | Malt 2 | 1,001 | Malt1 | 1,040 | Malt1 | 1,117 | Malt1 | 1,194 | |
Urambie | Feed1 | 1,348 | Feed1 | 1,309 | Feed2 | 1,194 | Feed1 | 1,194 | |
Oats | Durack | n/c | 0 | n/c | 0 | n/c | 0 | Feed | 840 |
Mitika | n/c | 0 | n/c | 0 | n/c | 0 | Feed | 910 | |
Bannister | n/c | 0 | n/c | 0 | n/c | 0 | n/c | 0 | |
*Assumptions for economic analysis: Achieved classification is based on 2017/2018 grain quality standards.
2017 $ per tonne calculated from local delivery prices (M.C. Crocker, Marrar NSW) – Wheat – AH1 $299, AH2 $285, APW $271, ASW $248, AUH2 $270, Feed $207; Barley – Malt FAQ $238, Malt 1 $260, Feed $223; Oats – Milling 1 $180, Milling 2 $165, Feed $150
2018 $ per tonne is calculated from cash price for the 21st Dec 2018 for the Newcastle port zone; Wheat – AUH2 $440, Feed1 $375; Barley – Malt 1 $385, Malt 2 $385, Feed $385; Oat – Milling 1 $460, Milling 2 $460, Feed $350
n/c = No commercial value hectolitre <50
Conclusion
In a year such as 2017 and again in 2018 which saw extreme frost events throughout the growing season, all varieties displayed the ability to recover from frost damage at stem elongation to some extent through re-tillering, which did contribute to the yields. For early sowing times, the longer-season winter-type wheat or barley varieties were better suited in frost-prone areas. For late-May sowing times, the shorter-season varieties were more suited. Although it has been common practice to match phenology to sowing date to begin flowering when the frost risk has passed, the higher number of severe frost events that have been occurring has highlighted the need to not only match the flowering time but also the start of stem elongation with sowing date, the latter to reduce the risk of stem frost damage in frost prone areas.
Acknowledgements
The research undertaken as part of this project was made possible by the significant contribution and co-operation from the growers who hosted this experiment. A sincere thank you to the Gollasch family at Wallacetown for this co-operation and support. Thank you to Warren Bartlett, John Bromfield, Kelly Fiske and Sophie Prentice for their technical assistance. The author would like to thank the GRDC for their support through the National Frost Initiative.
Useful resources
References
Frederiks, T. M., Christopher, J. T., Harvey, G. L., Sutherland, M. W., & Borrell, A. K. (2012). Current and emerging screening methods to identify post-head-emergence frost adaptation in wheat and barley. Journal Of Experimental Botany, 63(15), 5405-5416.
Frederiks, T. M., Christopher, J. T., Sutherland, M. W., & Borrell, A. K. (2015). Post-head-emergence frost in wheat and barley: defining the problem, assessing the damage,and identifying resistance. Journal Of Experimental Botany, 66(12), 3487-3498.
CliMate Weather Data https://climateapp.net.au, accessed 20 June 2018
Contact details
Mrs Danielle Malcolm
DPI Wagga Wagga, Pine Gully Rd, Wagga Wagga, NSW 2650
0429 171 337
danielle.malcolm@dpi.nsw.gov.au
@daniellemalcol5
GRDC Project Code: DAW00260,
Was this page helpful?
YOUR FEEDBACK