The risks and rewards of growing pulse crops in the low rainfall Mallee cropping region
Author: Michael Moodie and Todd McDonald (Frontier Farming Systems), Nigel Wilhelm (South Australian Research and Development Institute (SARDI)) and Ray Correll (RHO Environmentrics). | Date: 25 Feb 2020
Take home messages
- Season has the greatest impact on productivity with yields almost four times greater in a high rainfall year (decile 8-10), than in a low rainfall season (decile 2-4).
- The highest, and least variable grain yields were achieved on sandy loam – loam soil types, with up to 60% lower productivity, and high yield variability obtained on both heavy and sandy soils.
- Monte Carlo simulation using @Risk showed that lentils had both the greatest profit potential and lowest financial risk of all pulse crops over the long term.
- Chickpea and field pea are expected to have a negative gross margin in more than 30% of years but a high gross margin (>$500/ha) is expected in nearly one in five seasons.
Background
The adoption of pulse crops in low rainfall cropping regions such as the Mallee is increasing in response to recent research demonstrating the benefits of break crops to Mallee crop sequences. McBeath et al. (2015) measured cumulative break crop effects of over 1t/ha in wheat crops following the break phase at Karoonda in the South Australian (SA) Mallee. This research primarily attributed the break benefit to beneficial effects on the cycling and supply of nutrients. Moodieet al.(2017) reported cumulative break crop benefits of 0.5 to 1.5t/ha and increased profit up to $100/ha per year by including break crops such as pulses in low rainfall crop sequences, relative to maintaining continuous wheat.
While the farming system benefits of pulse crops are clear, there is a lack of regionally available data to support grower decisions on the most profitable pulse crops to select. This study compared pulse crop productivity and profitability on four major soil types in the Mallee region, to identify the most appropriate option for local farming systems. This research aims to provide growers with information on the relative productivity and profitability of legume break crops in this low rainfall region.
Method
Field trials
One current commercial variety of each of six pulse crops, of interest to growers in the low rainfall Mallee region, were compared over three seasons (2015-2017) on four regionally important soil types. The pulse crops used were; field pea (PBA Wharton), vetch (Rasina), lupin (PBA Barlock), lentil (PBA Hurricane XT), faba bean (PBA Samira) and chickpea (Genesis 090).
The trials were located at Waikerie (-34.26°S 140.00°E) and Loxton (-34.53°S 140.53°E). At each site, two trials were located on contrasting soil types within the same paddock. A brief description of each of the four soil types is provided below:
- Loxton flat — red loam located in a swale.
- Loxton sand — deep yellow sand located on the top of an east-west dune.
- Waikerie flat — heavy red-grey soil with limestone present 20-30cm below the surface.
- Waikerie sand — red sandy loam located mid-slope.
Each trial was sown after the break of the season into moist soil, to ensure successful rhizobial inoculation. Trials were sown on the following dates in each season:
- 2015: Loxton, 28 April; Waikerie, 1 May.
- 2016: Loxton, 26 May; Waikerie, 30 May.
- 2017: Loxton, 5 May; Waikerie, 9 May.
Each treatment at each site was managed independently to ensure it reached its potential. Agronomic management differences included herbicide choice, fertiliser rates and fungicide and pesticide applications. All trials were machine harvested across multiple dates in each season to ensure grain yield was measured soon after crops matured and to minimise losses.
Seasonal conditions
Figure 1 shows the annual rainfall received at Loxton and Waikerie for each of the three trial years. In 2015 and 2017, rainfall was generally below average, with growing season rainfall (GSR) at Loxton decile 5 and 3 respectively. At Waikerie GSR was decile 3 and 2 for 2015 and 2017 respectively. Both seasons had good April rainfall allowing for timely sowing in early May. In 2016, both sites received exceptional GSR, especially in spring, with a decile 10 GSR recorded at Loxton and decile 8 GSR at Waikerie.
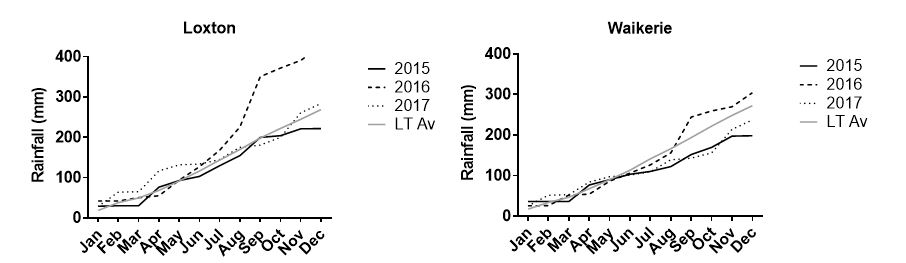
Figure 1. Cumulative annual rainfall for Loxton and Waikerie locations for the three trial years (2015-2017) and the long-term average (LT Av).
Profit risk modelling
A gross margin analysis was undertaken using Monte Carlo simulation with the Microsoft Excel add-in @Risk. Gamma distributions (which defined the long-term yield probability) were created for the grain yield of each crop using the 12 soil type x season yield outcomes that were generated by field trials (Table 1). Log logistic distributions of grain price were developed for each crop using long-term (2003 – 2017) average January grain price from the Farm gross margin and enterprise planning guide (Rural Solutions). The yield and price distributions were used to undertake 5000 iterations, generating a new gross margin distribution for each crop. The parameters for each crop used to create the Gamma yield and Log logistic price distributions in @Risk are provided in Table 1.
Table 1. Parameters for fitting Gamma distributions for grain yield and Log logistic distributions for grain price in @Risk to represent pulse crops in the Mallee region.
Crop | Gamma Grain Yield Distribution | Log Logistic Price Distribution | |||||
|---|---|---|---|---|---|---|---|
Mean (t/ha) | Alpha | Beta | Mean ($/t) | 5th Percentile ($/t) | Median ($/t) | 95th Percentile ($/t) | |
Field Pea | 1.45 | 1.152 | 1258.180 | 322 | 211 | 305 | 484 |
Lupin | 1.12 | 1.867 | 598.802 | 276 | 197 | 270 | 374 |
Chickpea | 0.77 | 1.46 | 529.101 | 609 | 288 | 600 | 960 |
Lentil | 1.08 | 1.653 | 653.594 | 684 | 401 | 630 | 1136 |
Faba Bean | 0.95 | 1.393 | 684.931 | 386 | 246 | 370 | 576 |
Vetch | 1.14 | 1.942 | 584.795 | 431 | 313 | 500 | 600 |
Results and discussion
Productivity
Field pea was the best yielding pulse crop, with an average yield of 1.3t/ha over all soil types and seasons. All other crop types averaged between 1 to 1.1t/ha, except for chickpea which had an average grain yield of 0.8t/ha.
There was a high level of variation in break crop yields both between seasons and between soil types. For example, the average yield of all break crops in 2016 was nearly four times greater than in 2015 and 2017 (Table 2). The pattern of rainfall and temperatures within years was also important. In 2015, a hot and dry spring favoured crops with early maturity — field peas, vetch and lentils produced the highest average yield. In contrast, frosts in August and September and significant rainfall in October 2017 favoured later maturity crops, with chickpea and lupins producing the highest yields.
Pulse crops were most productive on the loamy soil of the Loxton flat site, with all pulse crops averaging 1.45t/ha for the three seasons. However, average pulse crop yield on the sandy soil at Loxton were only 60% of those achieved on the loam, despite the sites being located just 250m apart. Lentils, chickpea and faba bean performed particularly poorly on the sandy soil, producing 50% of the grain yield achieved on the better soil type. At Waikerie, the best production was on the sandy loam soil (Waikerie sand) with an average yield of 1.1t/ha across all crops and seasons. In comparison, the average yield at the Waikerie flat site was 0.9t/ha. However, performance at this site was highly variable with seasonal conditions, being almost as productive as the Loxton and Waikerie sand sites in 2016 but extremely poor in 2015 and 2017.
Table 2. Pulse crop grain yields (t/ha) on four Mallee soil types for three seasons (2015-2017). Mean grain yield ± Standard Error of the Mean (SEM) is provided in the table.
Year | Site | Chickpea | Faba bean | Lentils | Lupin | Vetch | Field Pea |
|---|---|---|---|---|---|---|---|
2015 | Loxton Flat | 0.43±0.09 | 0.83±0.11 | 0.96±0.11 | 0.71±0.11 | 0.77±0.14 | 0.58±0.21 |
Loxton Sand | 0.22±0.03 | 0.55±0.05 | 0.64±0.05 | 0.60±0.09 | 0.86±0.03 | 0.71±0.05 | |
Waikerie Flat | 0.05±0.03 | 0.29±0.03 | 0.47±0.07 | 0.20±0.07 | 0.19±0.02 | 0.16±0.18 | |
Waikerie Sand | 0.45±0.01 | 0.46±0.04 | 0.82±0.07 | 0.49±0.05 | 0.69±0.04 | 1.21±0.03 | |
Average (all sites) | 0.29 | 0.53 | 0.72 | 0.50 | 0.63 | 0.66 | |
2016 | Loxton Flat | 1.55±0.36 | 2.92±0.33 | 3.13±0.45 | 2.88±0.32 | 2.84±0.25 | 3.02±0.48 |
Loxton Sand | 0.65±0.08 | 1.50±0.18 | 0.88±0.16 | 2.06±0.15 | 2.03±0.09 | 1.67±0.64 | |
Waikerie Flat | 1.15±0.06 | 1.65±0.15 | 2.53±0.05 | 1.81±0.35 | 1.81±0.31 | 3.58±0.07 | |
Waikerie Sand | 2.48±0.07 | 1.66±0.20 | 1.90±0.21 | 1.55±0.15 | 2.19±0.13 | 3.25±0.15 | |
Average (all sites) | 1.46 | 1.93 | 2.11 | 2.07 | 2.22 | 2.88 | |
2017 | Loxton Flat | 1.01±0.15 | 0.93±0.18 | 0.86±0.14 | 1.27±0.25 | 0.78±0.11 | 0.73±0.11 |
Loxton Sand | 0.36±0.05 | 0.18±0.12 | 0.31±0.07 | 1.18±0.04 | 0.68±0.07 | 0.4±0.07 | |
Waikerie Flat | 0.39±0.07 | 0.37±0.06 | 0.28±0.04 | 0.25±0.19 | 0.33±0.09 | 0.29±0.06 | |
Waikerie Sand | 0.51±0.10 | 0.10±0.07 | 0.20±0.04 | 0.46±0.08 | 0.47±0.10 | 0.60±0.07 | |
Average (all sites) | 0.57 | 0.39 | 0.41 | 0.89 | 0.57 | 0.50 | |
Average (all years) | 0.77 | 0.95 | 1.08 | 1.12 | 1.14 | 1.35 |
Profit risk modelling
Monte Carlo simulation showed that lentils are not only the most profitable break crop but are also the least risky (Table 3). The average gross margin for lentils is $500/ha, with a negative return from growing lentils expected in only 14% of seasons. Vetch was the next most profitable break crop with an average gross margin of $300/ha. However, vetch as grain is predominantly sold for seed to plant fodder and hay crops. And while there have been some high prices received for vetch in recent years, the grain market is limited and becomes easily flooded, which is not reflected in the @Risk simulation.
Chickpea and field pea had similar profitability and risk outcomes, with both having simulated mean long-term gross margins of $217/ha. Both crops had similar risks of not achieving a break-even gross margin (33-36%), and an 18% probability of the gross margin exceeding $500/ha. Despite both crops having a similar profitability and risk profile, our observations from the trials were that they could be complementary within a farm enterprise mix. Field peas matured early and tended to perform well in frost-free situations with terminal drought and/or high levels of heat in spring. Conversely chickpea matured late and performed well at sites which were frosted in early spring and in situations where soil moisture was available late in the season.
Lupin and faba bean had lowest simulated long-term gross margins of $132/ha and $114/ha respectively. Faba bean are also the riskiest crop and are not expected to break even in 44% of seasons. The downside risk of lupins is comparable to field pea and chickpea, but lupins has the lowest probability of achieving a high gross margin of more than $500/ha. This is due to low long-term price outcomes for lupins relative to other pulse crops.
Table 3. Mean gross margins for pulse crops and the probability of gross margin which are less than $0/ha or greater than $500/ha, generated with @Risk simulations.
Crop | Mean ($/ha) | Probability <$0/ha | Probability $0 - $500/ha | Probability >$500/ha |
|---|---|---|---|---|
Lentil | 498 | 14% | 49% | 38% |
Vetch | 300 | 16% | 63% | 22% |
Chickpea | 217 | 36% | 47% | 18% |
Field pea | 217 | 33% | 60% | 18% |
Lupin | 132 | 29% | 66% | 5% |
Faba bean | 114 | 44% | 46% | 10% |
Conclusion
Overall, most pulse crops had similar productivity potential, however the yields achieved in any one season were highly influenced by seasonal conditions (including the amount and distribution of seasonal rainfall, frost and heat events) and soil type. Season had the greatest impact on productivity, with yields almost four times greater in a high rainfall year (decile 8-10), than in a low rainfall season (decile 2-4). Pulse crop yields also varied by up to 60% between soil types. The highest and least variable pulse crop grain yield were achieved on sandy loam – loam soil types, with lower productivity and high yield variability obtained on both the heavy and sandy soils. As each of these soil types are encountered within a typical Mallee paddock, management options to improve pulse productivity and reliability on these constrained soils are required.
Monte Carlo simulation showed that lentils had both the greatest profit potential and lowest financial risk of all pulse crops over the long term. Vetch, chickpea and field pea are expected to generate long term gross margins of more than $200/ha. Chickpea and field pea are expected to have a negative gross margin in more than 30% of years, however a high gross margin (>$500/ha) is expect in in nearly one in five seasons. This information will allow Mallee growers to make more informed selections of the most appropriate pulse crops for their farming system.
Acknowledgements
This project ‘Adopting profitable crop sequences in the South Australian Mallee (MSF115)’ was supported with investment from the South Australian Grains Industry Trust (SAGIT) fund. The project was a collaboration between Mallee Sustainable Farming, Frontier Farming Systems (formally Moodie Agronomy) and the South Australian government.
Useful resources
References
McBeath TM, Gupta VVSR, Llewellyn RS, Davoren CW, Whitbread AM (2015) Break crop effects on wheat production across soils and seasons in a semi-arid environment. Crop and Pasture Science 66, 566–579.
Moodie M, Wilhelm N, Telfer P, McDonald T (2017) Broadleaf break crops improve the profitability of low rainfall crop sequences. In ‘Doing More with Less’. (Eds GJ O’Leary, RD Armstrong, L Hafner). Proceedings of the 18th Australian Society of Agronomy Conference, 24 – 28 September 2017, Ballarat, VIC, Australia © 2017. (Agronomy Australia Proceedings).
Rural Solutions SA farm gross margin and enterprise planning guide:
PIRSA - Consultancy Services
Contact details
Michael Moodie
7B Byrne Court Mildura VIC 3500
0448 612 892
michael@froniterfarming.com.au
@Moodie_ag
Was this page helpful?
YOUR FEEDBACK