Conservative nitrogen and seeding rates in frost prone landscapes reduces frost severity and duration but not enough; the opportunity cost outweighs the rewards.
Author: Ben Biddulph, Rebecca Smith, Chloe Turner, Trent Butcher, Steve Curtin, Brad Joyce, Ben Whisson, Richard Maccallum, Kelly Angel, Karyn Reeves, Sarah Jackson and Dean Diepeveen | Date: 04 Mar 2020
Key messages
- Reducing nitrogen and seeding rate to half of farmer practice can reduce frost severity and duration but not frost damage.
- Reducing seeding rate to half grower practice did not reduce frost damage, grain yield or gross income, but weed competition was compromised.
- Under nil and light frost (<20% yield loss) increasing nitrogen increased yield and gross margin.
- Under moderate frost (20-60% yield loss) increasing nitrogen increased yield and gross margin or had no effect depending on frost timing.
- Under severe frost (>60% yield loss) increasing nitrogen did not increase yield enough to improve gross margin.
- In frost prone landscapes maintaining normal grower practice of seeding rate and nitrogen for local yield potential gave the greatest financial return without frost, some financial advantage with moderate frost and, most importantly, was never worse off with severe frost.
Aims
To evaluate the effects of canopy management (through nitrogen and seeding rate) in frost-prone landscapes on frost severity and duration, canopy development (flowering time) and subsequent frost damage.
Introduction
There is anecdotal evidence from growers, identified through the RCSN networks, that crop canopies with higher yield potential are more susceptible to frost damage. Growers routinely report that nitrogen (N) applied after tillering in years of high yield potential appears to increase frost damage in frost-prone areas. As well as cereals crops growing after legumes in the rotation. Based on trials done in Western Australia (WA) and South Australia (SA), Rebbeck and Knell (2007) recommended conservative N inputs in frost-prone landscapes. As a result, growers have been recommended to adopted conservative nitrogen strategies, in frost prone area which may limit yield potential when frost does not occur. This project set out to determine if the opportunity cost of this was warranted in a range of sites with low, moderate and severe frost risk/ damage in the western and southern regions.
Trials were either extensive (PA scale 10x30m) to examine impacts of canopy management on changing frost severity, duration and damage reported in this paper or intensive (small plot 10x1.8m) reported by Nicol et al (2020) to evaluate synchronicity of crop development and crop sensitivity to frost.
Method
Trial treatments and design
Large-scale (10 × 30m plots) trials were sown in paddocks with a known history of frost damage in WA, New South Wales and Victoria from 2016 to 2018. For each trial, a flat, uniform and potentially nitrogen-responsive site (mostly canola stubble) was sown as close to the break of the season as possible (mostly early May) and managed according to local grower practice (see Table 1 for full details). At each site, soil samples to a depth of 10cm (WA) and 60cm (NSW and Vic) were taken across treatments before sowing and composited for basic soil analysis. Stubble samples were also collected to ensure consistent stubble load across treatments.
Each trial was a factorial of two seeding rates and three nitrogen rates arranged in a split plot design with four replicates. Seeding rate was the main plot and nitrogen was the subplot factor. The seeding rate treatments consisted of a ‘low’ seeding rate, which was half the standard grower practice and a ‘full’ seeding rate, which was the farmer practice (Table 1). Table 1 outlines the specific site details of the three nitrogen treatments that were applied at seeding. The treatments consisted of ~ half farmer N rate (N1; 6.5-20kg N/ha), an approximate farmer N rate (N2; 25-60kg N/ha), and a high N rate of 1.5 farmer practice (N3; 70-105kg N/ha). Farmer-scale equipment was used to seed the trial, to generate plot sizes of ~10-20m wide by 10-30m long and a buffer area of 10-15m between ranges to allow machinery switching between nitrogen treatments.
Measurements
To monitor the impact of crop canopy on frost severity and duration, unshielded air temperature was measured at canopy height. Temperature was logged every 15 minutes between early stem elongation (Z31) and crop maturity (Z87) in each plot. Tiny Tag Plus 2 (TGP-4017) loggers with internal temperature probes were installed at estimated canopy height (600mm) in the trials done in 2014 and 2015. In 2016, the temperature probes were installed at a canopy height of 300mm (Z31) and then moved progressively upwards to match canopy height over the course of the season using pre-drilled holes spaced at 10cm intervals. Seedling establishment counts were done 10-14 days after sowing. Zadok scores were assessed weekly from ~Z45 to Z70 to estimate awn peep (Z49), heading date (Z55) and flowering date (Z65). Frost damage was estimated via floret sterility samples taken at Z85. Harvest maturity cuts were taken at Z90. Floret sterility was assessed within 30 heads using the outside florets only and excluding the terminal and basal spikelets and supernumerary spikelets. Floret sterility was defined as the proportion of total florets in the sample assessed as frost-induced sterile florets. Maturity cuts were processed to obtain maturity biomass, number of viable heads, grain yield and harvest index. Grain was threshed and assessed for screenings and grain size. Two harvest cuts were harvested with a small-plot research header. Grain harvested from each plot was weighed and a 1kg grain sample retained for standard grain quality analysis to estimate delivery grades.
Statistical and economic analysis
Frost severity and duration
Traits reflecting the duration that the canopy was exposed to temperatures below specified thresholds were calculated by counting the number of observations from each logger that fell below the threshold between Z49 and Z85 and multiplying by 15 minutes. A trait describing frost severity was calculated for each logger by cumulatively summing the minimum observed temperatures below zero across the set of trial-specific frost dates between Z49 and Z85 and taking the absolute value. As duration and severity are calculated as sums, the magnitude of any treatment differences may reflect the number of frost events to which a trial was exposed. To model this multiplicative dependency, the duration and severity traits were Log10 transformed before analysis. Temperature from Lubeck (2016) was omitted from temperature analysis as the duration data was highly variable spatially within the site due to local topographic conditions. Response variables were analysed separately by applying a combined trials analysis approach in a linear mixed model framework. The treatment factors of seeding (‘half’, ‘full’) and nitrogen level (N1, N2, N3) were treated as fixed, as were trial sites (see Table 1 for actual rates). Terms to describe all two- and three-way interaction factors were included in the fixed part of the model. Interaction terms were tested using Wald-type tests (Kenward & Roger, 1997). Terms to account for the blocking structures of the trial designs were included in the random part of the model. All models were fitted with residual maximum likelihood (REML) (Patterson & Thompson, 1971) using the ASReml-R package (Butler, 2018) in the R statistical computing environment (R Core Team 2019).
Gross margins were calculated for each pair of composited plot header samples as Gross Income (yield x $/t) minus seed and nitrogen cost. Seed was costed at $300/t and nitrogen (urea) at $420/t (April 2016), $410/t (April 2017), and $510/t (April 2018). Potential grain classifications were based on CBH (WA) or Graincorp (SA, Vic, NSW) grain quality standards for the season and grain price by achieved grade based on CBH Kwinana or Graincorp Adelaide, Geelong and Newcastle cash pricing (based on protein, screening and hectolitre) on 20 Dec 2016, 2017, and 2018. When samples were not deliverable due to severely frosted grain and low hectolitre weight, a grain price based on a $20 discount from FED1 was used.
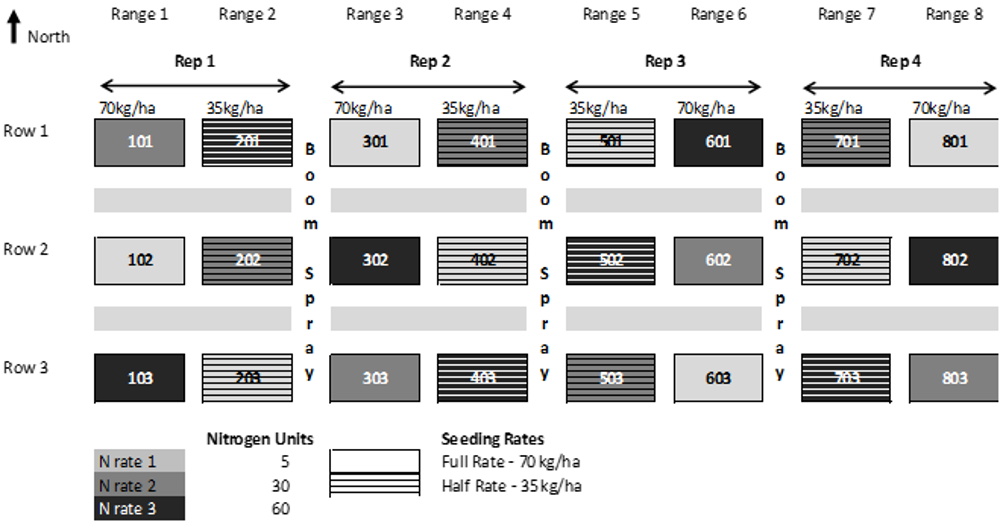
Figure 1. Typical trial layout and randomisation for the ENA18WICK6 trial at Wickepin in 2018.
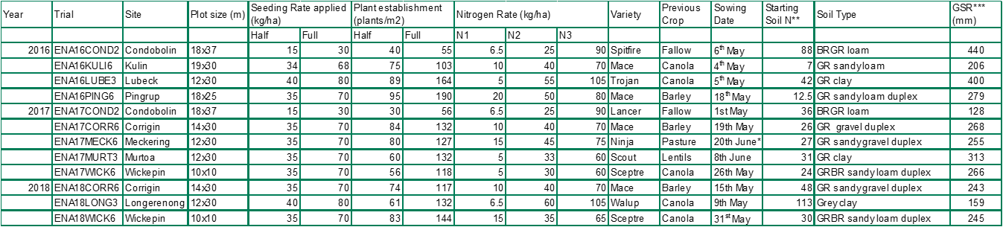
*Dry sown 28 May, **Total N, nitrate + ammonium kg/ha, 0-10cm western (WA) sandy soil types or 0-60cm eastern sites (NSW, Vic), ***GSR = growing season rainfall calculated as April to October.
Results and Discussion
As none of the interactions between seeding rate and nitrogen for yield components, maturity biomass, grain yield, grain quality and gross margin were significant, only the main effects of seeding rate (Table 2) and nitrogen (Table 3) are presented. Increasing seeding rate increased plant establishment in line with expectations (Table 1) and there was no effect of nitrogen on plant establishment (data not shown). There was no difference in phenology between seeding rate or nitrogen rate treatments at any of the sites based on weekly observations from stem elongation to after flowering, (Z31 to Z71). Where differences in frost damage were observed, it is likely to have been due to either very minor differences in crop development not detected by weekly observations or differences in frost exposure (combined effects of changes in frost severity and duration).
Frost severity and duration
Seeding rate
At seven of the 12 sites increasing seeding rate generally increased the severity of frost events between awn peep and late grain-fill (Figure 2). However, where there was an interaction with nitrogen rate, the effect was not consistent across sites. Increasing seeding rate also increased the duration of the frost events (hours below 0, -1, -3 and -4°C). Figure 3 illustrates the main effect of increasing seeding rate on the hours below -1⁰C (a) and -3⁰C (b). The effect of seeding rate was greater at lower temperatures, i.e. -3⁰C was greater than -1⁰C. The effect of seeding rate on increasing frost duration was clearer at the ‘grower practice’ and above nitrogen treatments (N2 and N3). Reducing the seeding rate to half grower practice reduced the severity of the frosts by a small but statistically significant amount.
Nitrogen
Increasing the nitrogen rate increased the severity and duration of frost events (Figure 2). In nine of the 10 trials able to be analysed, there was a consistent effect of nitrogen on duration below -1°C at both the ‘half’ and ‘full’ seeding rates. The exception was at Meckering in 2017 where higher nitrogen reduced frost duration at the ‘half’ seeding rate (Figure 4). Generally, the plots spent longer below the
-1°C temperature threshold when they produced they greatest biomass at the ‘half’ seeding rate N3 treatment or the full seed rate and N2 or N3 rate (Figure 4).
Crop biomass
Increasing canopy biomass was associated with an increase in frost severity and duration (Figure 5). Figure 5 shows fitted regressions of hours below -1⁰C against anthesis biomass for each trial. Within each trial, there was a consistent increase in the hours spent below -1⁰C as anthesis biomass increased (P < 0.001), ). For every unit increase in anthesis biomass (t/ha), the total time the canopy spent below -1⁰C during the susceptible window (Z49-85) increased by ~33 mins. Anthesis biomass increased from ~4 to 8t/ha from the ‘half’ seeding rate with N1 through to the ‘full’ seeding rate with N3. This increase of 4t/ha in anthesis biomass provided only a ~2hr 12min increase in the duration of the frosts for the whole susceptible window (Z49-85). A similar small, but statistically significant, response to seeding rate and nitrogen was seen for the time spent below -2, -3 and -4°C in trials that experienced these temperatures (data not shown). Although statistically significant, this is a relatively small impact compared to the effect of stubble management (Jenkinson et al 2017). In the work of Jenkinson et al (2017) a 4t/ha increase in stubble load at seeding increased subsequent frost duration during Z49-85 by 10-20hrs (@< -1°C) at York (2016), Corrigin (2016) and Cunderdin (2015). In summary, increasing anthesis biomass via higher seeding and nitrogen rates resulted in a small but consistent increase in frost severity and duration during the frost-susceptible window of Z49-85. However when compared to the impact of stubble load on frost severity, the impact of anthesis biomass was very small (<3 hours below -1°C compared to 10-20 hours for stubble).
Frost damage, floret sterility, yield components
Seeding rate
Seeding rate had no impact on frost duration and severity at any site. Reducing seeding rate to half the grower practice did not reduce floret sterility, anthesis biomass (data not shown), maturity biomass, harvest index, grain yield, grain quality (screenings and hectolitre data not shown), grain protein or gross income at 11 of the 12 sites (Table 2). Condobolin (2016) was the exception with higher seeding rate at this site delivering a slightly higher gross income (~$95/ha; Table 2). Further results are required to confirm the cause of this, but it was most likely due to the poorer establishment that resulted from a dry start/seedbed, which limited plant numbers at this site (~40 plants/m2;Table 1). More viable heads were observed at the higher seeding rate (Table 2) with grains per spike compensating for the lower plant establishment (data not shown). While the results indicate there was generally no opportunity cost associated with reducing seeding rate, reduced weed competition and greater weed seed set were observed at most sites.
Nitrogen biomass response
Across the trials, frost damage ranged from nil to ~ 60% sterility with no consistent response to nitrogen application at 11 of the 12 sites. The exception was at Corrigin in 2018 where the N3 treatment resulted in less sterility than the N1 and N2 treatments (Table 3), however this was not reflected in the other yield components measured. As expected, nitrogen increased biomass production and grain yield at most sites, with 10 of the 12 sites being N-responsive and delivering increased biomass at anthesis (data not shown) and maturity (Table 3). Lubeck in 2016 and Murtoa in 2017 on the grey vertosol soils were not N-responsive because they had just come out of a legume phase and had high background N (>30kg/ha N @ seeding) and adequate in-season mineralisation (1.4-1.6% organic carbon) (Table 1).
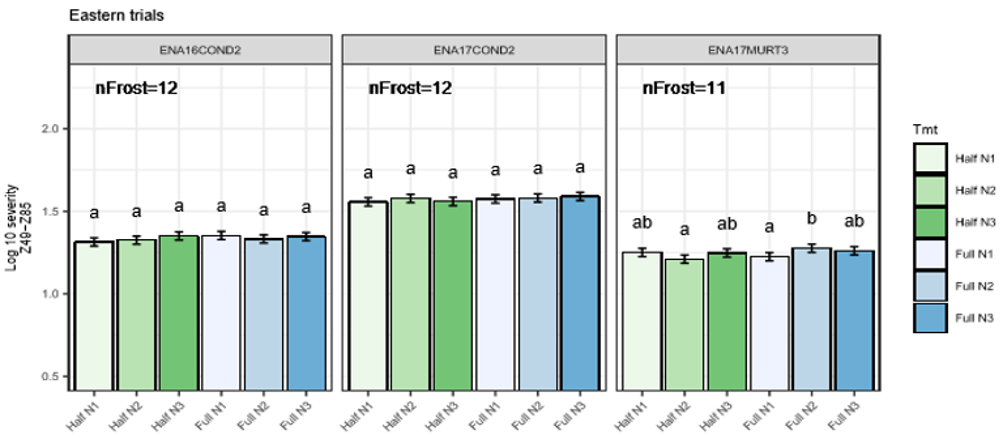
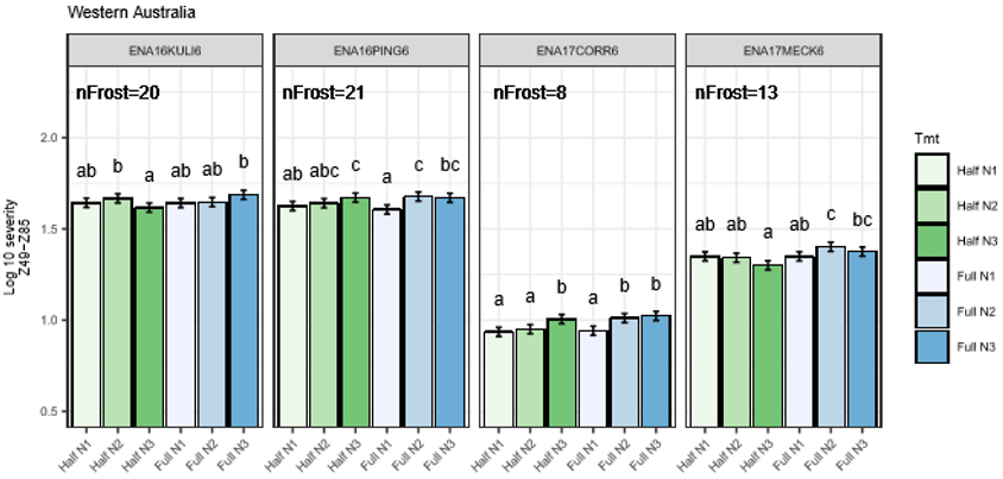
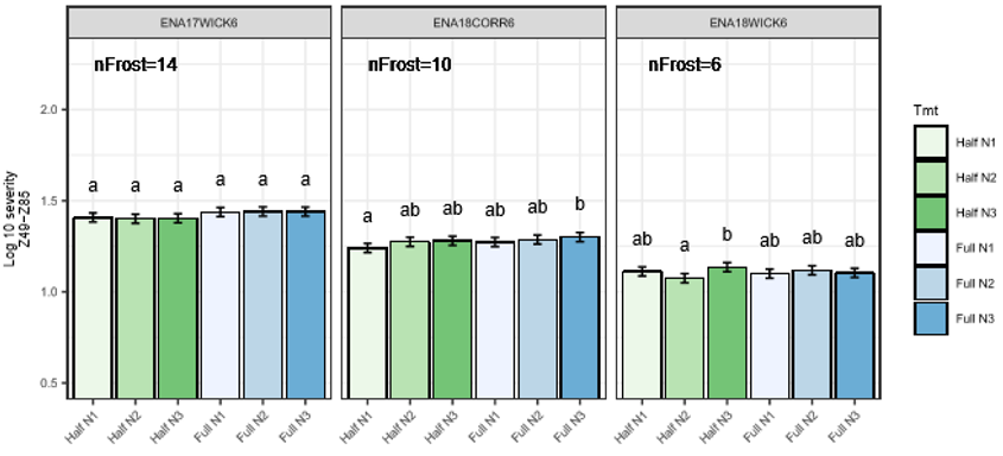
Figure 2. Predicted means for frost severity (Log10) (minimum temperature trends) during the crop development stages Z49 to Z85 for southern (NSW, Vic) and western (WA) region trials. Error bars +/- LSD (P=0.05) for comparisons within trials.
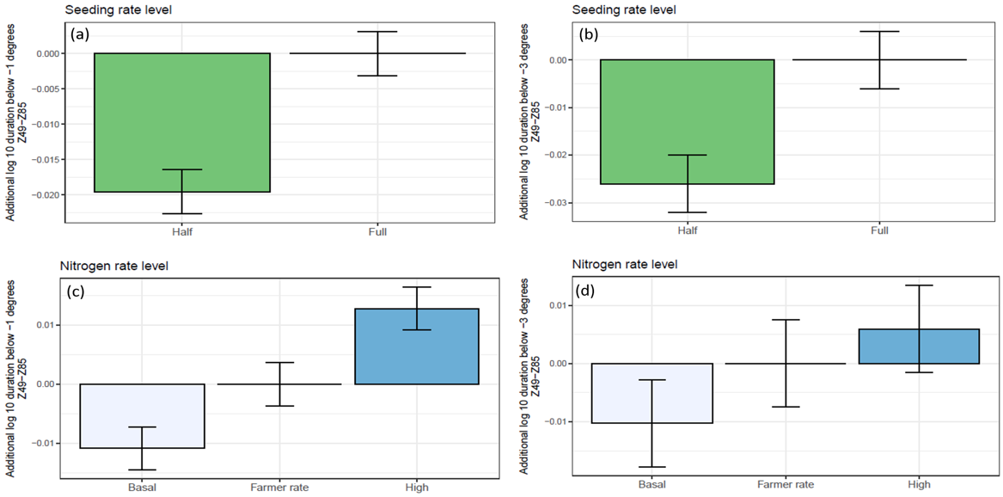
Figure 3. Predicted mean (Log10) for additional hours spent below -1°C (a,c) and -3°C (b,d) compared to the control, for the crop development stages Z49 to Z85 in relation to seeding (a,b) and nitrogen (b,c) rates. Control treatment was full seeding rate with farmer-standard nitrogen rate. Error bars +/- LSD0.05 for comparisons within trials.
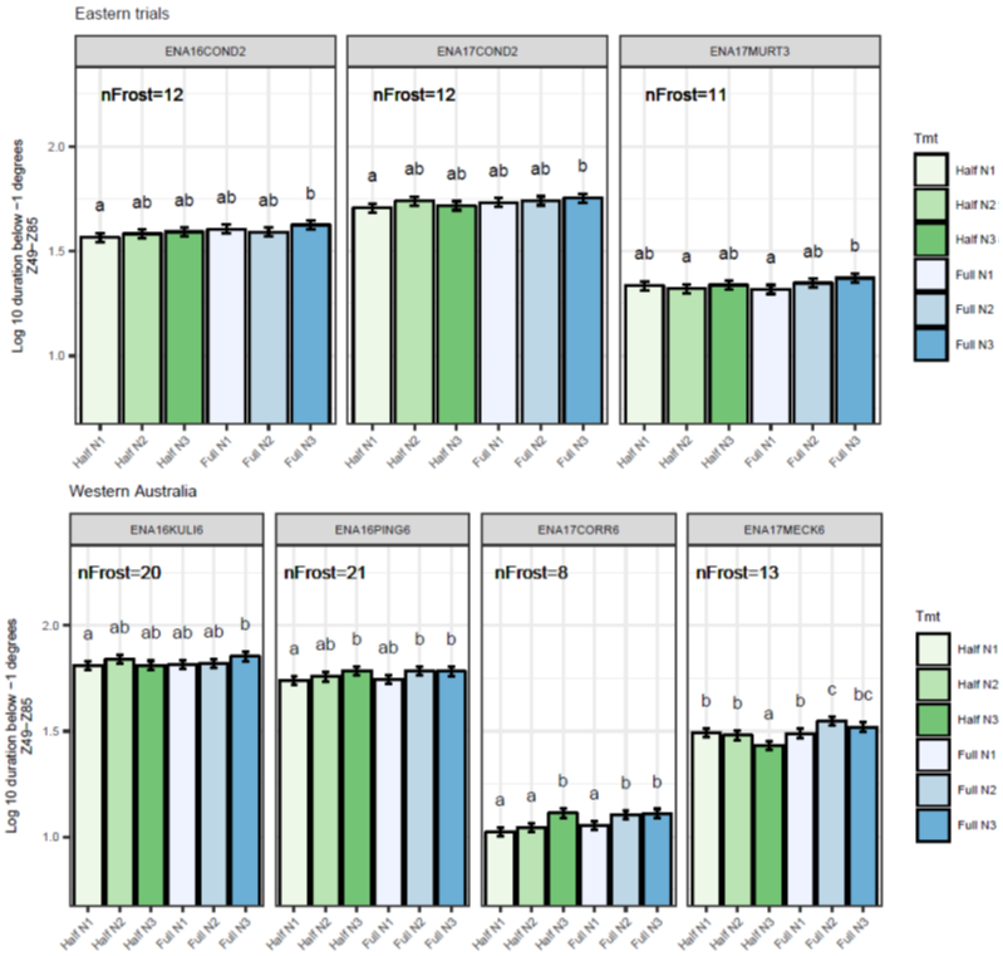
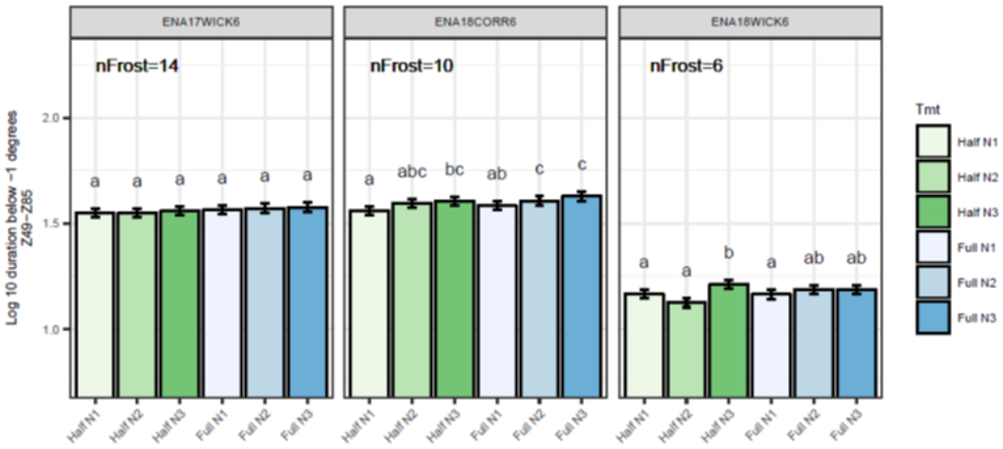
Figure 4. Predicted means for hours below -1°C (Log10) for the crop development stages Z49 to Z85 for southern (NSW, Vic) and western (WA) region trials. Error bars +/- LSD0.05 for comparisons within trials.
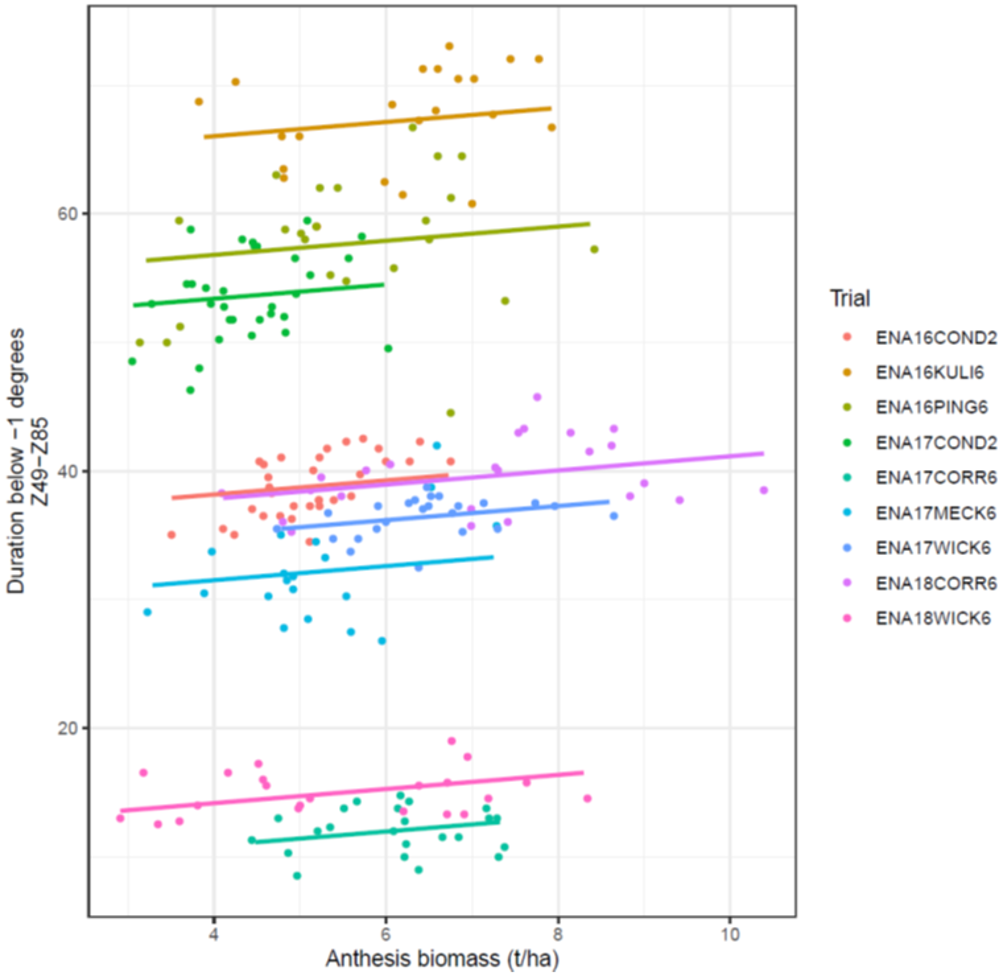
Figure 5. Fitted curves by trial for a regression of hours below -1°C for the crop development stages Z49 to Z85 against anthesis biomass (t/ha) for the southern (NSW, Vic) and western (WA) region trials, Significant at P< 0.001 with slope 0.55 with different intercepts for each trial.
Nitrogen grain yield response with severe frost damage/risk
Unlike biomass, grain yield was not always responsive to nitrogen application. Three sites with severe frost damage at or after flowering (~45-65% sterility; Pingrup and Kulin 2016) and during grain-fill (Murtoa 2017) had a low harvest index (0.13-0.25) and only a small grain yield response to nitrogen. In grain that avoided flowering frost at Kulin in 2016, extra nitrogen resulted in higher grain protein and the unfrosted grain achieved reasonable delivery grades (data not shown). However, the trial at Pingerup was also grain frosted and developed high screenings (>30%) and was not deliverable.. The relatively high applications of grower nitrogen in 2016 (a year of good summer and in-season rainfall; see Table 1) resulted in the same gross margins at the frosted sites regardless of nitrogen application because the slightly higher yield achieved by the higher nitrogen treatments was offset by the higher input cost. However, at Murtoa in 2017 the trial was very severely grain frosted and most treatments only just made GP1, FED1 or were not deliverable due to light grain (~18mg kernel weight) and low hectolitre (52-55 kg/L) weights. It appears that under severe, late-season frost damage at or after flowering, grain yield might not increase in response to extra nitrogen. If frosted at flowering, the extra grain protein resulting from higher nitrogen could offset the yield loss and maintain gross margins. However, if the crop is severely grain frosted (such as occurred at Pingrup in 2016 and Murtoa in 2018) it can become undeliverable due to shrivelled grain. Thus, to manage financial risk in severely frost-prone landscapes, growers should match their nitrogen inputs to their frost-affected yield potential.
Nitrogen grain yield response with moderate frost damage/risk
Moderate frost damage was recorded at head emergence at Corrigin (2018) and Condobolin (2016) and at stem elongation at Condobolin (2017) (Table 4). However, even with moderate frost damage at full-head emergence and a low harvest index (~0.23) at Corrigin (2018), there was still a significant grain yield and grain protein response to nitrogen and because of this gross margins of ~$100/ha were achieved in response to nitrogen application. Moderate frost at Condobolin just before head emergence in 2016 resulted in ~30% sterility (Table 4). However, the 2016 season had a favourable finish with 440mm GSR and a high harvest index so the frost sterility did not impact on grain yield. There was a 0.5t/ha increase in grain yield with nitrogen application and all grain made H1 (>13% protein) and there was no impact on gross margin from nitrogen. At Condobolin in 2017 the trial was frosted during stem elongation. Although the site was nitrogen responsive (see Table 3 - anthesis data not shown) this did not translate into a grain yield response, as most of the grain yield resulted from re-tillering and compensatory growth after the stem elongation damage (data not shown). As a result, there was no gross margin response to increasing nitrogen. In sites with moderate frost damage the gross margin response can therefore be variable. There can either be a small positive response as at Corrigin in 2018 where there was no impact on physical grain quality (screenings and hectolitre), or no response as at Condobolin in 2016 and 2017.
Nitrogen grain yield response with low frost damage/risk
In sites with nil or light frost that were nitrogen responsive (Lubeck in 2016 and in 2017 at Corrigin, Meckering and Wickepin; see Table 4), increasing nitrogen rate also increased maturity biomass, viable heads, grain yield and gross margin in line with expectations. Simply put, more nitrogen increased financial returns as expected on nitrogen responsive sites.
Conclusion
Reducing nitrogen and seeding rate to half of farmer practice can reduce frost severity and duration but not frost damage. Current farmer rates for seeding and nitrogen were associated with a small but significant increase in frost severity and duration but reducing these to about half the grower practice did not reduce frost severity and duration enough to cause a significant reduction in frost damage. Growers need to maintain robust seeding rates for weed competition and be confident in maintaining local district practice for nitrogen rates. In crops severely frost damaged at flowering and those frosted later during grain-fill there is not likely to be any loss in gross margin with nitrogen application in line with local yield potential. In moderately frosted crops with significant frost damage at stem elongation or pre-heading/booting, there is likely to be either no response or a small, positive response in yield and gross margin to nitrogen application. In areas of low frost-risk or in non-frosted crops there is, as expected, a clear financial response to nitrogen. In a nitrogen-limited environment in a good production year, such as occurred in 2016 in WA, growers are better off putting extra nitrogen into less frost-prone crops than wheat and/ or into less frost prone areas to maximise their returns.
In frost-prone landscapes, maintaining normal grower practice for seeding rate and nitrogen for local yield potential is likely to give the greatest financial return in years without frost, some financial advantage in years with moderate frost and, importantly, no negative consequences in years with severe frost.
Acknowledgments
The research undertaken as part of this project was made possible by the significant contributions of growers through both trial cooperation and the support of the GRDC. The authors would like to thank them for their continued support. In particular, we would like to thank the following collaborating growers: in Western Australia - Gary Lang Wickepin, Paul Hicks Pingrup, Neville Turner Corrigin, Sege, Mary and Michael Lucchesi Kulin, Rod & Neil Carter, Meckering; in Victoria - Ian Taylor Lubeck, Delahunty family Murtoa, Gullinem family Longerenong; in New South Wales NSW DPI Condobolin research staff for providing trial sites, and carrying out seeding and agronomic management, and to Peter Hanson, Theweatherlogger for installation, maintenance and data acquisition of onsite weather stations at all WA sites.
Paper reviewed by: Janet Paterson SciScribe, Bob French DPIRD and Garren Knell ConsultAg
Contact details
Ben Biddulph, DPIRD 3 Baron-Hay Court South Perth
08 9368 3431
08 9368 3082
ben.biddulph@dpird.wa.gov.au
Table 2. Main effects of seeding rate (‘half’ grower practice and ‘full’ grower practice) on frost damage, grain yield components and gross margin in extensive nitrogen trials 2016-2018. Significant differences between seeding rate within each trial indicated by different letters (p<0.05). Frost damage rated as nil (white fill), low (light blue fill), moderate (medium-blue fill) or severe (dark-blue fill) based on floret sterility, harvest index and visual observations from the field summarised in Table 4.
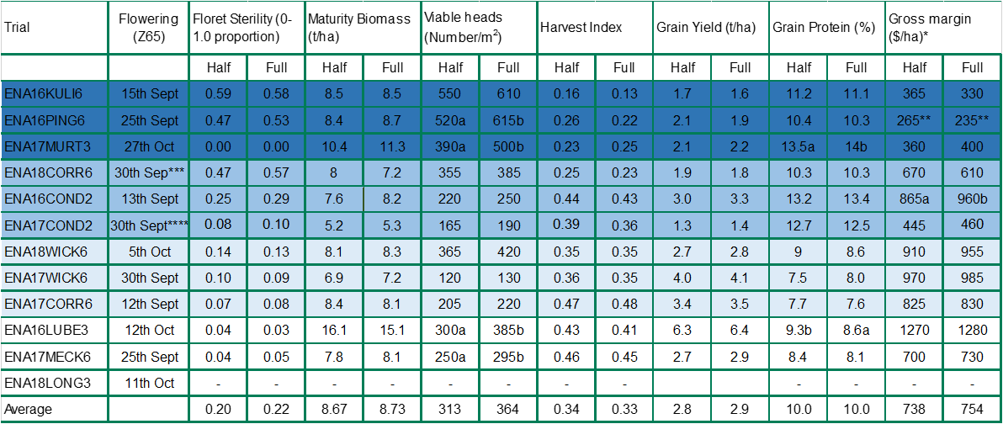
*Gross margin was calculated on each plot as Gross Income (yield x $/t) minus seed and nitrogen cost. Seed costed at $300/t. Nitrogen (urea) at $420/t, $410/t and $510/t in April 2016, 2017 and 2018. Potential classifications are based on CBH (WA) or Graincorp grain quality standards. Grain price based on CBH Kwinana or Graincorp Adelaide, Geelong and Newcastle cash pricing for appropriate receival grade (based on protein, screening and hectolitre) on 20 Dec 2016, 2017, 2018, ** not deliverable due to high screenings (grain price FED1-$20/t ), *** Delayed as head frosted at Z58 and based on late unfrosted tillers ,****Delayed as based on re-tillered canopy after severe stem elongation frost damage in late August.
Table 3. Main effects of nitrogen rate (N1 ~ half grower practice, N2 = grower practice and N3 = 1.5 grower practice) on frost damage, grain yield components and gross margin on extensive nitrogen trials 2016-2018. Significant differences between seeding rate within each trial indicated by different letters (p<0.05). Frost damage rated as nil (white fill), low (light blue fill), moderate (medium-blue fill) or severe (dark-blue fill) based on floret sterility, harvest index and visual observations from the field summarised in Table 4.
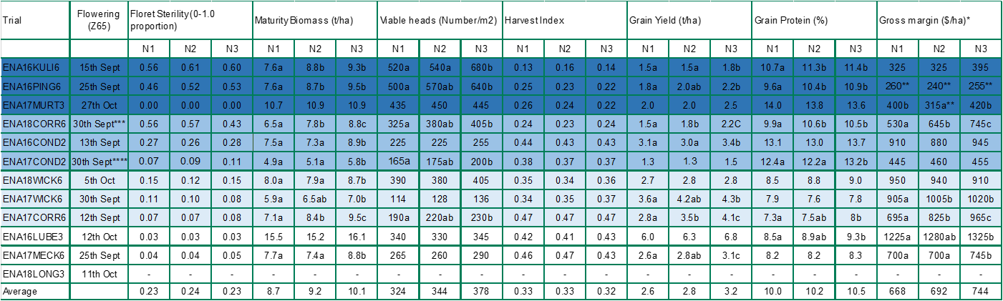
*Gross margin was calculated on each plot as Gross Income (yield x $/t) minus seed and nitrogen cost. Seed costed at $300/t. Nitrogen (urea) at $420/t, $410/t and $510/t in April 2016, 2017 and 2018. Potential classifications are based on CBH (WA) or Graincorp grain quality standards. Grain price based on CBH Kwinana or Graincorp Adelaide, Geelong and Newcastle cash pricing for appropriate receival grade (based on protein, screening and hectolitre) on 20 Dec 2016, 2017, 2018, ** severely grain-frosted and price based on a $20-30 discount from FED1 for un-deliverable grain. ***Delayed as head frosted at Z58 and based on late unfrosted tillers, ****Delayed as based on re-tillered canopy after sever stem elongation frost damage in late August.
Table 4. Effects of seeding rate (SR) and nitrogen (N) rate on frost severity and duration, frost damage, grain yield components and gross margin in extensive nitrogen trials (2016-2018). Frost damage rated as nil (white fill), low (light-blue fill), moderate (medium-blue fill) or severe (dark-blue fill) based on floret sterility, harvest index and visual observations.
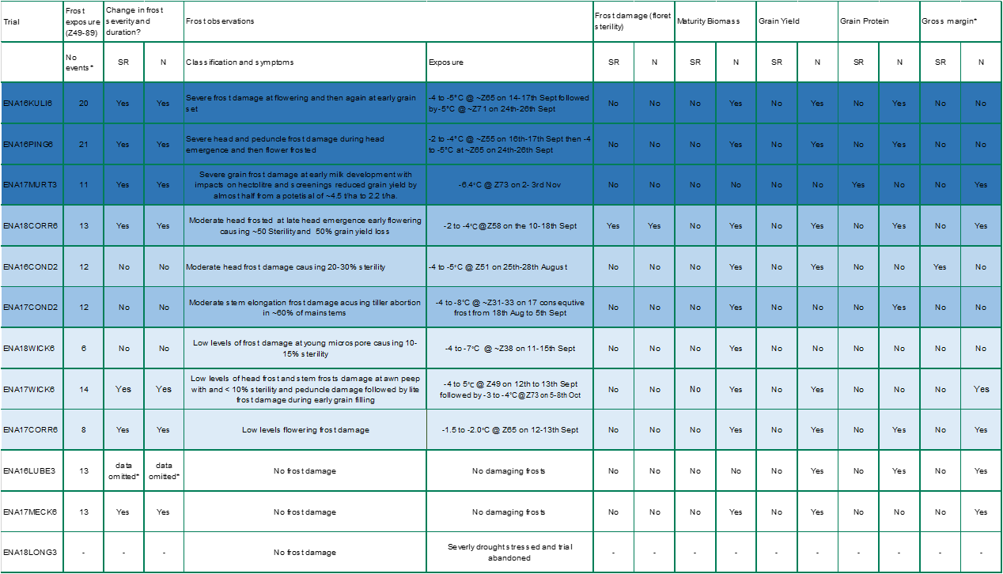
* data omitted from temperature analysis as duration data was highly variable due to local topographic conditions
References
Butler DG, Cullis BR, Gilmour AR, and Gogel BJ, (2018) ASReml-R 4 reference manual: mixed models for S language environments. Queensland Department of Primary Industries and Fisheries.
Kenward MG and Roger JH, (1997) Small sample inference for fixed effects from restricted maximum likelihood. Biometrics 53:983–997.
Patterson HD and Thompson R, (1971) Recovery of inter-block information when block sizes are unequal. Biometrika 58:545-554.
Nicol D et al, (2020) Nitrogen and density impacts on frost risk of wheat. GRDC Crop Updates Perth 2020.
R Core Team (2019) R: A language and environment for statistical computing. R Foundation for Statistical Computing, Vienna, Austria.
Rebbeck M, and Knell G, (2007) managing Frost Risk : A guide for Southern Australian grains. Ground Cover Direct.
Reeves K, (2019), SAGI Report Frost Risk Management (DAW00260) Frost severity, duration and damage in a series of extensive nitrogen trials conducted 2016-2018. SAGI West Technical Report.
Smith et al, (2017). Stubble management recommendations and limitations for frost prone landscapes. GRDC Crop Updates Perth 2017. http://www.giwa.org.au/_literature_225512/S1_Rebecca_Smith_2017
GRDC Project Code: DAW00260, LIV0004, FGI1707-003WCX, BWD00032, TAR0010, DAN00215,
Was this page helpful?
YOUR FEEDBACK