Designing sorghum crops for Australia’s climate in 2050
Author: Graeme Hammer, University of Queensland | Date: 08 Sep 2020
Take home messages
- Anthropogenic global warming demands that we think about how to adapt sorghum traits and management for likely future climates
- There is an urgent need to develop varieties with high-temperature tolerance to minimise the effects on seed set of increasing high temperature risk
- Existing approaches to adapting traits (genotype) and management (G×M) for effective use of water through the crop cycle remain relevant but will not be adequate to maintain productivity once global warming of ∼2oC is reached and the positive effects of elevated levels of CO2 on crop growth are counterbalanced
- Novel approaches seeking improvement in fundamental crop water use efficiency will be required.
Introduction
Climate risks pervade agriculture and generate major consequences on crop production. We do not know what the next season will be like, let alone the season 30 years hence. Yet farmers need to decide on genotype and management (G×M) combinations in advance of the season and in the face of this environment (E) risk. Beyond that, breeders must target traits for future genotypes up to 10 years ahead of their release. The considerable knowledge of climate, both past and future, gives us insight into climate variability and trends. Climate risks incorporate natural climatic variability, anthropogenic global warming, and their interactions. Climate trends introduce more uncertainty and reduce the relevance of experience depending on the rate of change. We know that CO2 and temperature are increasing (Figure 1), and this influences rainfall patterns, high temperature risks, and water use efficiency for crops. The extent of global warming has already generated significant impacts on crops and is projected to have enhanced effects into the future. High temperature has both direct effects (e.g. on pollen viability and seed set) and indirect effects via increased vapour pressure deficit (vpd) that increases crop water use and exacerbates crop water limitations on crop performance. However, enhanced levels of CO2 are known to improve water use efficiency in sorghum and act to partially counter the negative effects on the water balance from high temperature and vpd.
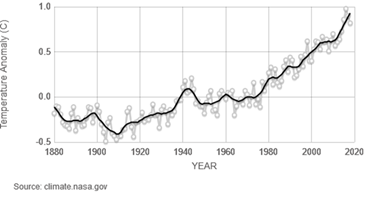
Figure 1. Observed global temperature anomaly (◦C) since 1880 relative to 1951 to 1980 average
(Source: NASA/GISS)
The considerable knowledge of crop growth and development responses to CO2, drought, and high temperature have been integrated into advanced crop simulation models in APSIM. Here we explore by simulation the design of crops best suited to current and future environments. A yield–risk framework is used to identify adapted G×M combinations. The yield–risk trade-off is a major factor confronting farmers managing cropping systems faced with significant climate risk.
Climate scenarios and crop simulation
Fifteen sites throughout the sorghum production region, each with long-term historical climate data (~100 years), were selected for the simulation study. Daily weather data for future climate conditions was derived from shifts in temperature and rainfall projected by 2050 from a total of 33 general circulation models (GCMs) (Figure 2). The shifts, relative to a 1990 base, in mean October through March temperature and precipitation for the north-eastern Australia region by 2050 show ranges of +0.7 to +3.3oC for temperature and −15 to +20% for rainfall for the 33 GCMs. Three GCMs were selected to represent optimistic, central, and pessimistic scenarios. The projected CO2 concentration for 2050 was set at 541 ppm, and 400 ppm was used for the current climate baseline.
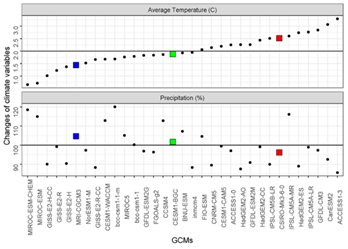
Figure 2. Change in October through March mean temperature (oC) and precipitation (%) in north-eastern Australia by 2050 relative to 1990 base predicted by 33 general circulation models (GCMs). Horizontal lines indicate +2oC shift in mean temperature and no change (100%) in mean precipitation. The GCMs are arranged from left to right in order of increasing predicted shift in temperature. Coloured squares indicate the three GCMs selected to represent optimistic (blue), central (green), and pessimistic (red) scenarios used in this study.
Crop simulations were performed using current and projected climates for a broad range of sowing dates, antecedent soil moisture, crop management (row configuration, plant density), and genotype attributes (maturity, tillering, high temperature tolerance). Simulated yields were used to generate average yield vs risk plots. Risk was assessed as the frequency of occasions that yield fell below a “break-even” threshold, which was set here as 1.5 t/ha.
Current and future effects of water and high temperature stresses
While water as a limiting factor to crop yield remained a key feature of the sorghum production environment in future climates, it was only under the pessimistic climate projection scenario that any increase in severity was likely to occur (data not shown). This result reflects the interacting negative and positive effects on the crop water balance of increased temperature via increased VPD, projected changes in precipitation, and the increased crop water use efficiency associated with increased CO2 concentration.
In contrast, the frequencies of high-temperature stress effects were predicted to increase substantially for 2050 climate conditions (Figure 3). As expected, the projected warming by 2050 increased the frequency of exposure to damaging temperatures around flowering causing increased incidence of yield loss independent of the degree of high temperature tolerance assumed. A high-temperature-tolerance threshold of at least 36oC was required to minimise the incidence of high temperature stress in 2050 climate scenarios.
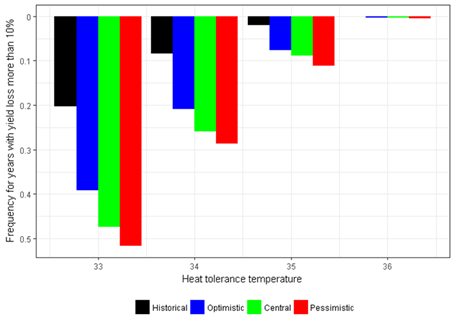
Figure 3. Frequencies of cases with simulated yield loss >10% due to the occurrence of high-temperature events around flowering for historical climate (black bars) and future (2050) climate generated by three general climate models selected to represent optimistic (blue), central (green), and pessimistic (red) for genotypes varying in their threshold maximum temperature tolerance from 33oC (susceptible) to 36oC (tolerant)
Crop adaptation under current and future climates
Broad adaptation
Broad adaptation for the entire region was examined using a yield–risk plot for average simulated yields across all production environments (Figure 4) using standard management (solid 1-m rows, density 5 plants m−2) for the range of genotype factors affecting crop canopy dynamics and water balance (i.e. maturity and tillering combinations). There was a clear trade-off between productivity and production risk among the genotype combinations for the historical climate scenario (Figure 4(a)). The technology frontier on the yield–risk plot is represented by those points with greatest yield at a given risk up to the point where average yield starts to decrease as risk increases, that is, for the points on the frontier where there is no outcome with greater yield at the given risk level nor lesser risk at the given yield level. The peak of this frontier (circled on Figure 4(a)) was populated with early maturing and high tillering types.
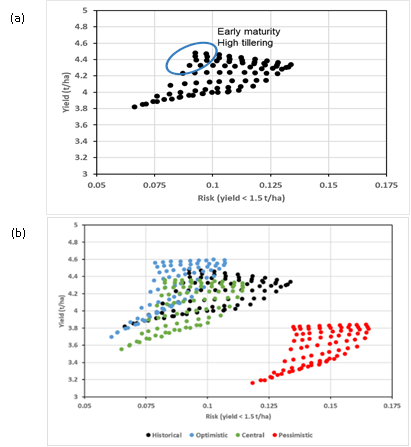
Figure 4. (a) Simulated average yield–risk trade-off for the historical climate scenario for genotypes varying in maturity and tillering grown with standard agronomy. Average yield for each genotype is derived from simulations over all environments (sites, seasons, soils, times of sowing, antecedent moisture levels) sampled in the production region. Production risk for each putative genotype is quantified as the frequency of occasions in which simulated yield falls below 1.5 t/ha.
(b) Simulated average yield–risk trade-off for genotypes varying in maturity and tillering grown with standard agronomy (as in (a)) but for the four climate scenarios used in this study: historical (black), optimistic (blue), central (green), and pessimistic (red).
Yield–risk plots were also generated across all relevant environments using standard management to examine broad adaptation within each future (2050) climate scenario (Figure 4(b)). In all cases, the nature of the technology frontier was not affected so that the early maturing and high tillering types remained preferred. However, there were significant shifts in average yield and risk associated with each future climate scenario. There was a slight advantage associated with the optimistic scenario due to the improved water balance (i.e. higher rainfall and CO2 fertilisation effects). However, for the pessimistic future climate scenario, average yield was substantially reduced, and production risk was substantially increased. This reflects a tipping point in the crop water balance as the slightly reduced rainfall and increase in VPD (via temperature increase) impose negative consequences sufficient to outweigh the enhanced crop water use efficiency from CO2 fertilisation.
These general effects on broad adaptation across the entire north-eastern Australian sorghum production region were also maintained in the patterns of response evident at subregional levels, although there were differences in average yield and risk levels among subregions (data not shown). It is clear that avenues for broad adaptation in sorghum in these production environments based on modifying canopy development and water use dynamics via changes in maturity and tillering cannot counter the negative effects anticipated in future climates once global warming of ∼2oC is reached.
Specific adaptation
Specific adaptation was examined at subregion level by considering management options beyond the standard management used for the analysis of broad adaptation. Yield–risk plots for simulations of all possible G×M combinations affecting canopy dynamics were generated across all relevant environments within each current or future climate scenario for sites in each subregion. The yield–risk plots in Darling Downs East (DDE – Pittsworth, Dalby, Miles) and South-West (DDSW - Goondiwindi, Moree) showed potentially advantageous shifts on the technology frontiers (Figure 5). In all cases, this was associated with simultaneous reduction in both population density and tillering (and skip row in DDSW), which would generate a reduced canopy size relative to the broad adaptation combination. However, for the favourable, higher-yielding environment (DDE), the shift from the standard broad adaptation practice was only minor, as risk in this situation was generally low. It involved only a small reduction in risk that was associated with some trade-off in reduced yield. However, for the less favourable, lower-yielding environment (DDSW), the reduction in risk with specific adaptation was greater and could be obtained with little or no trade-off in yield depending on climate scenario.
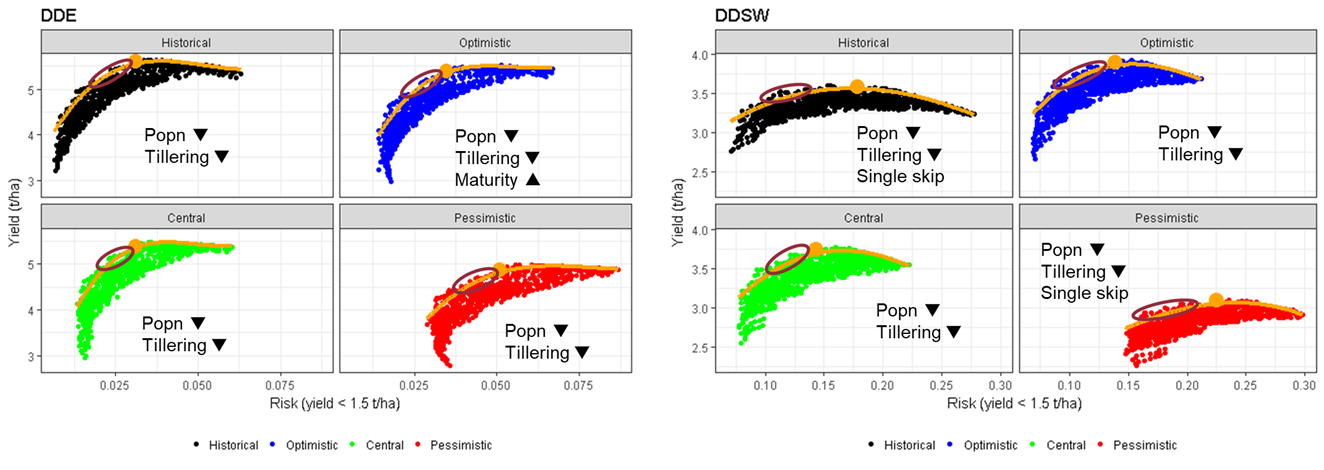
Figure 5. Simulated average yield–risk trade-off for all combinations of genotype (G) and management (M) attributes for the Darling Downs East (DDE) and Darling Downs Southwest (DDSW) subregions for the four climate scenarios used: historical (black), optimistic (blue), central (green), and pessimistic (red). The solid line indicates the technology frontier of superior G×M combinations. The filled circle indicates the position of the optimal G with standard M (broad adaptation combination). The ellipse indicates potentially superior combinations of G×M associated with the indicated directional shifts in factors relative to the broad adaptation case. Note that scales differ for the two subregions, as the risk is generally low for the higher-yielding subregion (DDE)
While the genotype and management strategies needed to cope with all three climate scenarios were similar, options to adapt sorghum to these future production environments based on modifying canopy development and water use dynamics via t changes in both G×M attributes included in this analysis cannot counter the negative effects anticipated in future climates once global warming of ∼2oC is reached.
Conclusions
Anthropogenic global warming contributes another dimension to the existing climate risks affecting crop productivity in sorghum. The results in this case study indicate the urgent need for high-temperature tolerance to mitigate effects on seed set and address increasing high temperature risk. Further, existing approaches to adapting traits and management (G×M) for effective use of water through the crop cycle will not be adequate to maintain productivity once global warming of ∼2oC is reached and the positive effects of CO2 fertilization are counterbalanced. Novel approaches seeking improvement in crop water use efficiency will be required. These are the focus of current research.
References
Chenu, K., van Oosterom, E. J., McLean, G., Deifel, K. S., Fletcher, A., Geetika, G., Hammer, G. L. (2018). Integrating modelling and phenotyping approaches to identify and screen complex traits: Transpiration efficiency in cereals. Journal of Experimental Botany, 69: 3181–3194.
Hammer, G.L., McLean, G., van Oosterom, E., Chapman, S., Zheng, B., Wu, A., Doherty, A. and Jordan, D. (2020) Designing crops for adaptation to the drought and high temperature risks anticipated in future climates. Crop Science, 60: 605-621.
Hammer, G.L., van Oosterom, E., McLean, G., Chapman, S.C., Broad, I., Harland, P. and Muchow, R.C. (2010). Adapting APSIM to model the physiology and genetics of complex adaptive traits in field crops. Journal of Experimental Botany, 61:2185-2202.
Singh, V., Nguyen, C. T., McLean, G., Chapman, S. C., Zheng, B., van Oosterom, E. J., & Hammer, G. L. (2017). Quantifying high temperature risks and their potential effects on sorghum production in Australia. Field Crops Research, 211: 77–88.
Acknowledgements
Development of the sorghum model used in this project has been supported by the significant contributions of growers through the support of the GRDC. The biological research on high temperature effects was conducted as part of a Federal Government Department of Agriculture Forestry and Fisheries funded project on Climate Ready Cereals and the modelling presented here was supported by an Australian Research Council Centre of Excellence project.
Contact details
Graeme Hammer
The University of Queensland
Centre for Plant Science, QAAFI
Brisbane, QLD 4072
Email: g.hammer@uq.edu.au
GRDC Project Code: CE140100015,
Was this page helpful?
YOUR FEEDBACK
