Canola yield response to sowing date
Author: Imma Farre, Martin Harries, Jackie Bucat, Stacey Power, Andrew Blake, Salzar Rahman, Stephanie Boyce, Helen Cooper. (Department of Primary Industries and Regional Development) | Date: 11 Feb 2021
Key messages
- Crop simulation can help agronomists and growers make informed decisions about crop management to maximise profitability.
- When dry-sowing canola early, once the break of season occurs assess the likelihood of achieving target yields and adjust inputs accordingly, to maximise profitability.
- If sowing canola at the break of season, assess the likelihood of achieving a certain yield, depending on the date of the break, and adjust inputs or consider alternative crops to maximise profitability.
Aims
This paper has two aims: 1) to validate the APSIM-Canola model for very early sowings and current cultivars, and 2) to provide better advice to agronomists and growers about canola yield expectations depending on location, break of season date and season type.
Introduction
In the past decade, there has been a trend towards earlier sowing of canola by Western Australian growers, with dry-sowing as early as April (Fletcher et al 2016). However, there is limited experimental yield data on very early sowings in March or early-April. While the APSIM-Canola model had been validated for WA for the traditional sowing window and for older varieties (Farre et al 2002), further model validation was needed to extend the use of the model for very early sowings and current varieties. In this project, time of sowing trials conducted in four locations over the past two years were used to validate the APSIM-Canola model for current conditions. A simulation study using climate data for the past 21 years was used to place the past two years of trials in the context of the long-term climate.
Past simulation studies identified the optimal sowing window (OSW) required to maximise yield for different locations in WA and the risk of achieving a certain yield if the break of season was late (Farre et al 2018). OSW Table and risk figures for 24 locations are available at: https://www.agric.wa.gov.au/canola/canola-sowing-time-maximise-yield-western-australia
Method
Field trials and model simulation
Time of sowing field trials were conducted in four locations (Mullewa, Wongan Hills, Dale and Grass Patch) in 2019 and 2020. Eleven triazine tolerant varieties (open pollinated and hybrids) of a wide range of maturity types were used (from early to mid-late). Times of sowing (4-5) ranged from March to June. Pre-sowing irrigation was applied to simulate different break of season dates. The earlier times of sowing (March and April sowings) had significant amounts of supplementary irrigation applied to help crop establishment in hot conditions and to prevent crop failure (See Bucat et al 2021 paper in these proceedings for more details).
The crop simulation model APSIM-Canola (v.7.9) (Farre et al 2002; Keating et al 2003) was run with 2019 and 2020 climate data and management conditions for the four locations to validate the model.
Long-term simulation study
A long-term simulation study was done for the four trial locations using the APSIM-Canola model and climate data for the period 2000-2020 (21 years). Simulations were run with the same times of sowing (20 March, 10 April, 1 May, 22 May and 12 June), cultivars, soil moisture at sowing and post-sowing irrigation amounts as in the 2019 field trials.
Results
Model validation
The APSIM-Canola model satisfactorily simulated the flowering dates for three generic cultivars (early, mid and late season length types), five times of sowing and four locations (Figure 1a). The error in simulating flowering date (root mean square error) was 6.8, 5.7, 6.6 and 10.1 days for hybrid Hyola350, ATR Stingray, ATR Bonito and ATR Wahoo, respectively. Canola yields were simulated with an error of 482, 443 and 396kg/ha for ATR Stingray, ATR Bonito and ATR Wahoo, respectively (Figure 1b). The error in the yield simulations was greater for early sowings, but overall the slope of the yield to sowing time relationship was satisfactorily simulated (Figures 2 and 3)
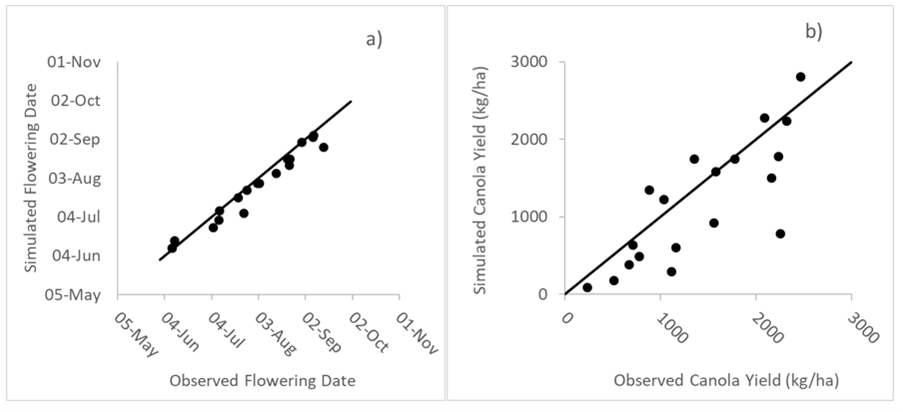
Figure 1. Observed versus APSIM simulated for a) flowering date and b) grain yield for canola cultivar ATR Bonito at four locations and over five sowing dates in 2019 (20 March, 10 April, 1 May, 22 May and 12 June). Solid line is 1:1 line. RMSE (root mean square error) for flowering was 6.6 days and for yield was 443kg/ha.
In the 2019 Mullewa trial, the yield decline with delay in sowing was very steep (Figure 2). When the model was run with the same soil moisture and irrigation amounts as in the trial, simulated yields were close to the observed yields (Figure 2). Running the model without the supplementary irrigation simulated yields of 620 and 1097kg/ha for the March and April sowing, respectively, compared to yields of 1637 and 1482kg/ha with irrigation (Figure 2). These results demonstrate that the high yield achieved in the March sowing in the 2019 Mullewa trial would not have been possible without the post-sowing irrigation.
The canola yield response to sowing date in the 2019 and 2020 Dale trials (Figure 3) was satisfactorily simulated by the APSIM-Canola model, with peak yields for the mid-April wet sowing. For sowings after 1 May, the model simulated a yield decline of 20kg/ha for each day delay in sowing. The year 2019 was representative of the long-term conditions, as it had a yield response to sowing date similar to the average of the 21-year simulations.
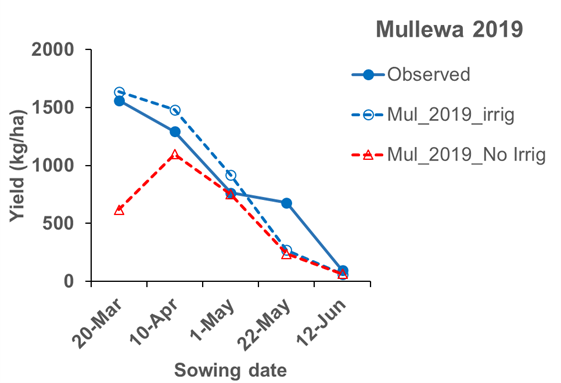
Figure 2. Observed canola yields in the 2019 Mullewa field trial (solid blue line with full circle) and APSIM simulated yields (dotted lines with empty symbols) with and without supplementary irrigation, for cultivar ATR Bonito. See text for explanation on irrigation.
Simulation study
The APSIM-Canola model satisfactorily simulated the slope of the yield decline with sowing date (Figure 2 and 3). However, the yield response to sowing date had a significant year to year variability (Figure 4). If a particular trial is undertaken in a very good or very bad season, it may not represent the long-term conditions for that location.
Simulations showed a large year to year variability in yields (Figure 4). The yield response to sowing date was significantly different between the wet and dry years in Mullewa for the past 20 years (Figure 4). The simulation study demonstrated the importance of playing the season and adjusting management and inputs according to yield expectations to maximise profitability.
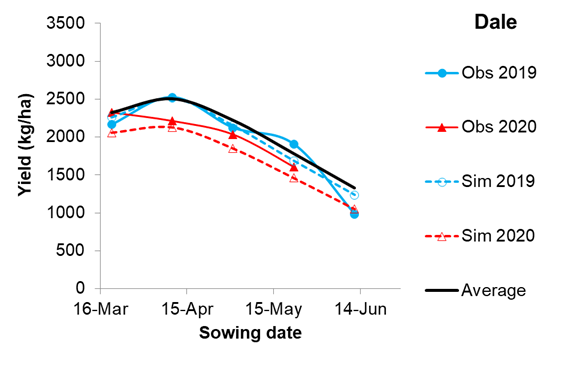
Figure 3. Observed canola yields in the Dale field trails in 2019 (solid blue line with circle) and 2020 (solid red line with triangle) for the different sowing dates and APSIM simulated yields for 2019 and 2020 (dotted lines with empty symbols). Black line is the average of 21-year simulations.
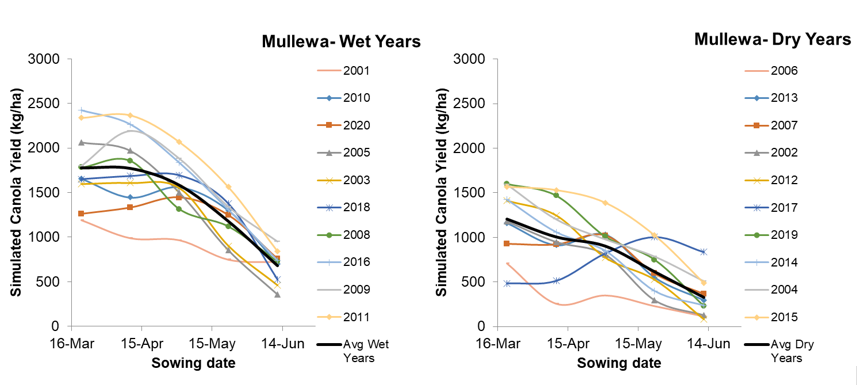
Figure 4. APSIM simulated canola yields for the wettest 50% of years and the driest 50% of years over the period 2001-2020 for the same sowing dates, initial soil moisture and supplementary irrigation as the 2019 field trial at Mullewa, for cultivar ATR Bonito. Black line is the average of the 10-year simulations.
Conclusions
The APSIM-Canola model can satisfactorily simulate flowering dates and grain yield for current cultivars across locations and sowing dates in WA.
In the field trials, it was possible to obtain economic yields with very early sowings with supplementary irrigation, but in field conditions it might be difficult to establish canola in very hot conditions in March.
Crop simulation can help agronomists and growers make informed decisions about crop management to maximise profitability.
As a rule of thumb, in WA, in low and medium rainfall locations, the optimum sowing period (wet sowing) to maximise grain yield for a medium maturity cultivar is April; and in high rainfall locations the optimum sowing window is from early-April to mid or late-May, if frost is not an issue.
References
Farre I, Robertson MJ, Walton GH, Asseng S (2002) Simulating phenology and yield response of canola to sowing date in Western Australia using the APSIM model. Australian Journal of Agricultural Research 53, 1155-1164.
Farre, I, Bucat, J, Harries, M, French, B & Seymour, M, 2018, ‘Canola sowing time to maximise yield in Western Australia’, AusCanola Conference, 2018, Perth Western Australia.
Fletcher, A, Lawes, R & Weeks, C 2016, 'Crop area increases drive earlier and dry sowing in Western Australia: implications for farming systems', Crop and Pasture Science, vol. 67, no. 12, pp. 1268-1280.
Keating BA, Carberry PS, Hammer GL, Probert ME, Robertson MJ, Holzworth D, Huth NI, Hargreaves JNG, Meinke H, Hochman Z, McLean G , Verburg K, Snow V, Dimes JP, Silburn M, Wang E, Brown S, Bristow KL, Asseng S, Chapman S, McCown RL, Freebairn DM, Smith CJ (2003) An overview of APSIM, a model designed for farming systems simulation. European Journal of Agronomy 18, 267-288.
Acknowledgments
The authors gratefully acknowledge GRDC funding Project DAW1901-005RTX
Contact details
GRDC Project Code: DAW1901-005RTX,
Was this page helpful?
YOUR FEEDBACK