Cereal disease update 2021
Take home messages
- Proactive disease management that combines variety and paddock selection and appropriate fungicide use provides effective, economic control of cereal diseases.
- Stripe rust may be important during 2021 if there are wet spring conditions. Use the new StripeRustWM App to support in-crop fungicide decisions.
- Development of fungicide resistance is increasing in cereal pathogens and can be slowed through adoption of integrated control strategies and prudent use of fungicides.
Background
Favourable conditions during autumn and spring provided good conditions for cereal crops in 2020 with below average rainfall during winter slowing development of many foliar diseases. Field trials by Agriculture Victoria measured losses of up to 50% due to foliar diseases, thus demonstrating the ongoing importance of effective strategies to minimise losses due to disease in risk situations.
Wheat - Stripe rust
Stripe rust was common in wheat crops during 2020 and often required fungicide control to protect yield. The management of stripe rust has become more complex with recent exotic incursions and the re-occurrence of an old strain, which impacts resistance in many varieties.
Evaluation of the new stripe rust management App (StripeRustWM) during 2020 proved it to be a useful tool to support in-crop decisions regarding stripe rust control.
Strains of stripe rust and disease ratings
Surveillance of cereal rust by The University of Sydney has detected four exotic strains (pathotypes) of wheat stripe rust in Australia since 1979; two of these incursions were detected in the last four years. Three of these incursions may have originated from Europe (1979, 2017 and 2018) while North America (2002) was implicated as the source of the other.
During 2020, The University of Sydney detected approximately seven different strains of wheat stripe rust in eastern Australia, adding to the complexity of assigning resistance ratings to varieties. The usual practice in the assignment of rust ratings is to provide a ‘worst case’ rating for the strains known to occur in a region. However, during 2020, an old strain (64 E0 A-) of stripe rust was detected in northern New South Wales (NSW) which has increased virulence on many varieties. Because of the ability of rust to spread large distances it was appropriate to provide some warning of the potential impact of this rare strain on varieties. Therefore a ‘/’ has been adopted (e.g., MR/S) to reflect the potential for two reaction types for the affected varieties. This effectively provides a warning of how a variety will perform if this older strain becomes more widespread during 2021. Unfortunately, it is not possible to predict which strains will dominate in any season, and rapid testing to determine strains is not possible. Therefore, monitoring of crops is still an important component of disease management.
The University of Sydney’s rust surveillance team now map cereal rust strains during the season on the web (see link within Useful resources section of this paper). This service is useful to gain an idea of strain distribution nationally. It takes about three weeks from when a sample is collected to when these results are available.
Evaluation of StripeRustWM App
A new tablet-based app, ‘StripeRustWM’ developed by DPIRD and GRDC, was released in 2020 to support in-crop decision making for the management of stripe rust of wheat. StripeRustWM uses information, including variety resistance rating, plant growth stage, presence of rust either within the crop or the district and expected yield to estimate potential losses. It’s available free for iPads and Android tablets from the Apple App Store and Google Play.
A field trial conducted during 2020 compared disease development and grain yield with the App’s predictions. Three varieties, Mace (susceptible to very susceptible (SVS)), Wyalkatchem (susceptible (S)) and Scepter (moderately susceptible to susceptible (MSS)) were grown and fungicides applied based on five treatment scenarios (Table 1) and an untreated control.
Table 1. Fungicide treatments applied to evaluate predictions of the StripeRustWM App, Horsham 2020.
Number | Fungicide TreatmentA | Growth stage | Date |
|---|---|---|---|
T1 | At first sign of stripe rust in district | Z33 | 15/9/2020 |
T2 | At trace of stripe rust in crop | Z39 | 28/09/2020 |
T3 | At presence of stripe rust hot spots | Z49 | 13/10/2020 |
T4 | At 10% of leaves infected with stripe rust | Z65 | 22/10/2020 |
T5 | A second spray is applied when a trace of stripe rust found in T1 treated plots (5 weeks later) | Z65 | 15/9/2020 & 22/10/2020 |
T6 | Untreated control | - | - |
A 210g/L prothioconazole + 210g/L tebuconazole applied at 300mL/ha.
Stripe rust development was consistent with varietal resistance ratings with greater severity in Mace (SVS) than Wyalkatchem (S) and Scepter (MSS) (Table 2). For each variety, fungicide sprays applied early in the epidemic (rust identification in the district (T1) or traces in the crop (T2)) provided best protection. Delaying application until the occurrence of hot spots (T3) or before 10% of leaves were found with stripe rust infection (T4) were significantly less effective. A second spray (T5) on plots with recurring infection following the first spray (T1) provided some suppression of the late infection. A natural infection of Septoria was found in all the three varieties (Table 2) and its impact was considered within the App by using the ‘other diseases’ parameter.
Table 2. Stripe rust and Septoria severity (percentage leaf area affected) of wheat varieties Mace (SVS), Wyalkatchem (S) and Scepter (MSS) in response fungicide treatments applied at different disease levels after the first sign of stripe rust in the district at Horsham during 2020.
Stripe Rust severity (%) | Septoria severity (%) | ||||||||
|---|---|---|---|---|---|---|---|---|---|
TreatmentsA | Z65B | Z75 | Z65 | ||||||
Ma.C | Wy. | Sc. | Ma. | Wy. | Sc. | Ma. | Wy. | Sc. | |
T1 | 6 | 3 | 5 | 50 | 9 | 14 | 5a | 2a | 4a |
T2 | 0 | 1 | 1 | 1 | 1 | 0 | 5a | 3a | 5a |
T3 | 27 | 19 | 20 | 34 | 16 | 17 | 28b | 22b | 21b |
T4 | 43 | 33 | 29 | 78 | 53 | 43 | 24b | 24b | 24b |
T5 | 4 | 4 | 6 | 20 | 6 | 10 | 4a | 2a | 4a |
T6 | 58 | 33 | 27 | 91 | 63 | 38 | 25b | 25b | 32b |
P = | 0.759 | <0.001 | 0.990 | ||||||
LSD (0.05) = | ns | 8.6 | ns | ||||||
ATreatment are listed in Table 1 BGrowth stages: Z65, mid flowering; Z75, milk development according to Zadoks et al. (1974). CMa = Mace; Sc. = Scepter; Wy = Wyalkatchem.
Grain yield differences corresponded with stripe rust severity due to the applied treatments (Table 3). Yield predictions made by the StripeRustWM App for the three varieties showed a moderate to good correlation with actual yields (R2 = 0.65 to 0.72) (Figure 1). For susceptible varieties, there was a better agreement between the experiment and the App’s predictions of loss. For the partially resistant variety, Scepter (MSS), the App overestimated the yield loss compared with what actually occurred, indicating the need for further refinement of the App.
Close association (>65%) between the experiment grain yield and predicted yield for all varieties with different resistance ratings demonstrated that the StripeRustWM App is a useful tool to assist with disease management. These findings will be used to further improve the App’s predictions.
Table 3. Comparison of StripeRustWM App predictions with actual grain yield of three wheat varieties in response to foliar fungicides treatments applied at different levels of stripe rust infection, Horsham 2020.
Grain Yield (t/ha) | |||||||
|---|---|---|---|---|---|---|---|
TreatmentA | StripeRustWM Predictions | Field Experiment | |||||
Mace (SVS) | Wyalkatchem (S) | Scepter (MSS) | Mace (SVS) | Wyalkatchem (S) | Scepter (MSS) | ||
T1 | 6.0 | 6.4 | 6.7 | 5.1bc | 5.7b | 6.3b | |
T2 | 5.5 | 6.1 | 6.5 | 6.0cd | 6.3bc | 6.7bc | |
T3 | 5.9 | 6.3 | 6.6 | 5.7cd | 6.4bc | 6.6bc | |
T4 | 5.5 | 5.8 | 5.9 | 4.3b | 4.6a | 5.7a | |
T5 | 6.2 | 6.5 | 6.8 | 6.4d | 6.8c | 7.0c | |
T6 | 2.9 | 3.4 | 3.9 | 3.0a | 4.1a | 5.4a | |
Loss %B | 53 | 48 | 43 | 53 | 40 | 23 | |
P = | - | - | - | <0.001 | <0.001 | <0.001 | |
LSD (0.05) = | - | - | - | 0.91 | 0.87 | 0.60 | |
ATreatments are listed in Table 1.B Estimated loss percent (%) for each variety calculated using the highest and lowest yields predicted/actual in response to treatments. Within variety mean yields with one letter in common are not significantly different.
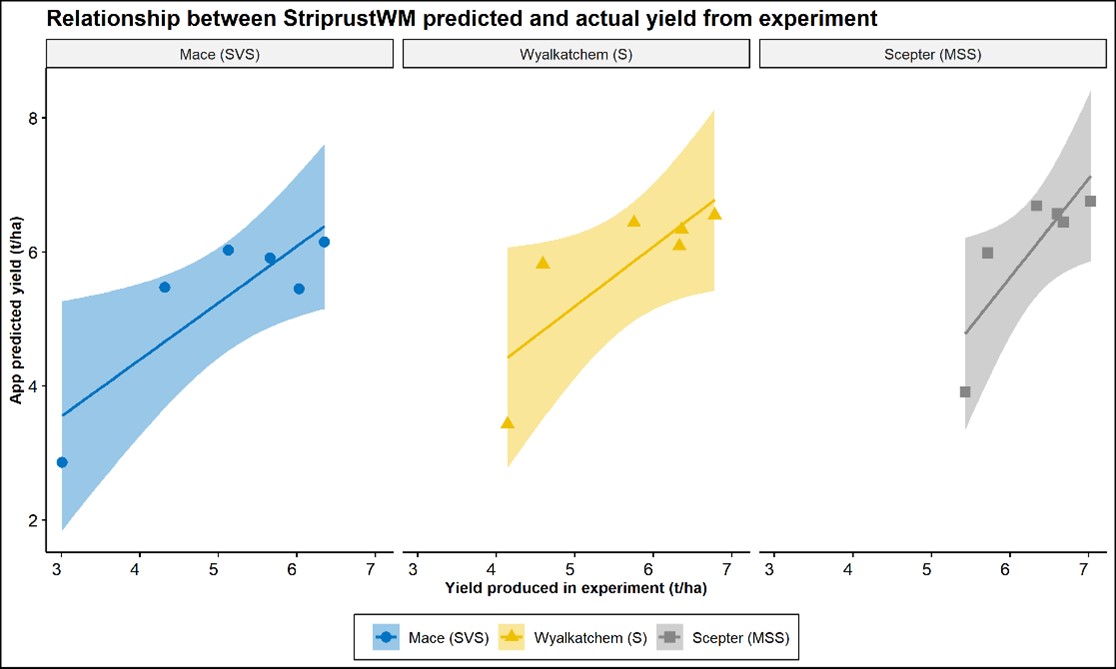
Figure 1. Comparison of grain yield of Mace (SVS), Wyalkatchem (S) and Scepter (MSS) between Horsham experiment and StripeRustWM App prediction, with shaded areas representing +/-10%.
Stripe rust management in 2021
Stripe rust may be important if there are favourable conditions during late winter and spring. The summer rain and green bridge has supported carry over of rust spores on volunteer cereals and increased susceptibility of many wheat cultivars has contributed to heightened risk from stripe rust. It is therefore important that growers take the following steps to protect wheat production from rust:
- Use a current cereal disease guide to determine risk.
- Develop a fungicide management plan, keeping in mind management of fungicide resistance.
- Download the StripeRustWM App for iPads and tablets and run scenarios to help predict potential losses in individual paddocks.
Barley foliar diseases
During 2020, stubble-borne foliar diseases such as spot form of net blotch (SFNB), net form of net blotch (NFNB) and scald were common. Barley leaf rust was present in the high rainfall areas late in the season. Fungicides significantly reduced the impacts of these diseases in susceptible varieties. Inoculum of all these diseases will be present leading into the 2021 season, so proactive management will be needed where favourable conditions develop for crops and disease.
NFNB has become more common in Victoria due to the cultivation of susceptible varieties such as RGT Planet and Fairview and the moderately susceptible (MS) variety Compass. A new virulence for Spartacus CLA has also developed making it susceptible in some cases. The frequency of this new virulence was low in 2020, so growers should monitor susceptible crops and be prepared to apply fungicides if significant NFNB infection develops. Previous experiments have shown that more than 10% leaf area affected by NFNB can cause losses.
NFNB most commonly causes losses during seasons where grain yield potential is greater than 5t/ha and there are wet conditions during spring. In high yielding crops, grain yield losses can be as high as 22% (2t/ha) while grain quality is also commonly affected with reduced grain size and weight.
Yield loss due to net blotches during 2020
During 2020, Agriculture Victoria conducted experiments at Curyo (with BCG) and Longerenong to determine potential losses for varieties with different resistance/susceptibility to NFNB in the Wimmera and Mallee regions of Victoria. NFNB was the target disease, however SFNB also developed due to infection from airborne spores from neighbouring paddocks and favourable seasonal conditions.
Within each experiment, six barley varieties and a NFNB very susceptible (VS) breeding line VB9613, were sown. Six replicates of two treatments were applied: 1) No disease, and 2) Disease to determine loss.
Severe NFNB developed at the Curyo site (Table 4) and moderate NFNB developed at the Longerenong site (Table 6) in the VS line VB9613 resulting in 17% and 8% grain yield loss, respectively and reductions to grain quality (Table 5). This demonstrated that NFNB can be a damaging disease in both the Wimmera and Mallee regions in susceptible varieties.
Moderate NFNB and severe SFNB infection developed in RGT Planet which is highly susceptible (SVS) to both diseases and resulted in 20% and 9% grain yield loss at the Curyo and Longerenong sites, respectively. These losses show that RGT Planet should be managed for multiple foliar diseases during favourable seasons to minimise losses. Varieties that were rated susceptible (S) or better to NFNB had very low levels of NFNB, thus demonstrating that avoiding the most susceptible varieties will decrease the risk of yield loss.
SFNB caused moderate infection and NFNB caused low infection in Commander (both sites) and Alestar (Curyo only) which resulted in significant grain yield losses. In both cases, it was likely the combination of SFNB and NFNB resulted in losses, again highlighting the need to proactively manage multiple barley diseases to minimise losses.
Fathom, Maximus CL and SakuraStar had relatively low disease severity at both sites but significant yield losses were measured only at the Curyo site. The cause of this is difficult to determine, however it is likely that these resistant varieties diverted metabolic energy for disease resistance, instead of grain yield. This has also been observed in low rainfall regions of Western Australia (WA) and South Australia (SA).
Grain quality data was not available for the Longerenong experiment at time of reporting.
Table 4. Disease severity and grain yield of six commercial barley varieties and one breeding line very susceptible to net form net blotch in response to high and low disease treatments, Curyo 2020.
| Rating | Disease severity (% leaf area affected) 6 October, Z85 | Grain Yield (t/ha) | ||||||
|---|---|---|---|---|---|---|---|---|---|
Variety | NFNB | SFNB | NFNBa | SFNBb | DiseaseC | No DiseaseC | % loss | ||
Fathom | MS | RMR | 1 | 0 | 5.1 | 5.7* | 10 | ||
Maximus CL | MS | MRMS | 0 | 0 | 5.6 | 6.2* | 10 | ||
Commander | MS | MSS | 2 | 8 | 4.8 | 5.8* | 17 | ||
SakuraStar | S | MS | 1 | 0 | 4.9 | 5.5* | 11 | ||
Alestar | S | S | 2 | 8 | 4.6 | 5.2* | 12 | ||
RGT Planet | SVS | SVS | 5 | 19 | 5.2 | 6.5* | 20 | ||
VB9613 | VS | MR | 39 | 0 | 4.4 | 5.3* | 17 | ||
*= statistically significantly different at 5% when the high and low disease treatments were compared, a Average of the top three leaves of ten tillers per plot, b Average of single plot assessment per plot. C Disease treatment = Inoculated with NFNB infected stubble residue and no fungicide to determine loss; No disease treatment = no infected stubble and seed and foliar fungicide to determine yield potential.
Table 5. Grain quality of barley lines in response to net form of net blotch high and low disease treatments at Curyo, Vic during 2020. (Disease treatment = Inoculated with NFNB infected stubble residue and no fungicide to determine loss; No disease treatment = no infected stubble and seed and foliar fungicide to determine grain quality potential.)
| Screenings (%<2.2mm) | Retention (%>2.5mm) | 1000 grain weight (g) | ||||||
|---|---|---|---|---|---|---|---|---|---|
Variety | Disease | No Disease | Disease | No Disease | Disease | No Disease | |||
Fathom | 4 | 3 | 76 | 82 | 39 | 40 | |||
Maximus CL | 4 | 2* | 71 | 81* | 36 | 37 | |||
Commander | 10 | 6* | 63 | 76* | 34 | 37 | |||
SakuraStar | 10 | 6* | 64 | 75* | 36 | 39* | |||
Alestar | 5 | 2* | 68 | 79* | 34 | 37 | |||
RGT Planet | 10 | 2* | 41 | 76* | 34 | 39* | |||
VB9613 | 18 | 4* | 24 | 57* | 33 | 37* | |||
*= significantly different at 5% when the high and low disease treatments were compared
Table 6. Disease severity and grain yield of barley line with differing susceptible net form of net blotch and spot form of net blotch in response to high and low disease treatments at Longerenong during 2020.
| Rating | Disease severity (% leaf area affected) 29 September, Z75 | Grain Yield (t/ha) | |||||||
|---|---|---|---|---|---|---|---|---|---|---|
Variety | NFNB | SFNB | NFNBa | SFNBb | DiseaseC | No DiseaseC | % loss | |||
Fathom | MS | RMR | 0 | 1 | 6.1 | 6.3 | 0 | |||
Maximus CL | MS | MRMS | 0 | 2 | 6.5 | 6.7 | 0 | |||
Commander | MS | MSS | 1 | 6 | 5.9 | 6.3* | 6 | |||
SakuraStar | S | MS | 0 | 3 | 6.1 | 6.0 | 0 | |||
Alestar | S | S | 0 | 8 | 5.5 | 5.7 | 0 | |||
RGT Planet | SVS | SVS | 2 | 14 | 6.7 | 7.4* | 9 | |||
VB9613 | VS | MR | 20 | 3 | 5.5 | 6.0* | 8 | |||
*= significantly different at 5% when the high and low disease treatments were compared, a Average of the top three leaves of ten tillers per plot, b Average of single plot assessment per plot. C Disease treatment = Inoculated with NFNB infected stubble residue and no fungicide to determine loss; No disease treatment = no infected stubble and seed and foliar fungicide to determine yield potential.
Oat: - red leather leaf
During 2020, red leather leaf (RLL) was common in the medium and high rainfall zones of Victoria and bacterial blight was common in all regions. A survey of Victorian oat crops (AgriFutures investment project) identified that RLL was the most common foliar disease, being present in 80% of crops while bacterial blight was found in 55% of paddocks. Septoria, stem rust and crown rust were also found at low levels, in the high rainfall zone. Crown rust and stem rust were found in the North East, late in the season. Inoculum of these diseases will be present in 2021 and may cause losses if favourable conditions develop during the season.
RLL is the most common and damaging foliar disease of oat in Victoria. Two experiments were conducted near Horsham during 2020, with one investigating the grain yield and quality losses in six milling oat varieties and another AgriFutures project to investigate the hay yield and quality loss in eight hay oat varieties. For each variety, six replicates each of two treatments, 1) High Disease and, 2) Low Disease were compared to determine losses.
Hay yield and quality loss
RLL infection was severe and caused significant reductions to stem thickness and hay yield losses at Longerenong during 2020 demonstrating that RLL should be managed in hay oats to maximise production. RLL severity was significantly more severe in varieties rated MS or worse, while disease severity was low in the MRMS rated Forester and Tungoo (Table 7). Stem thickness and hay yield were reduced by RLL in five of the eight varieties. Losses were very similar between varieties (10-13%), except for Kingbale (17%). The reason for this was unclear as disease severity was the same as Wintaroo. The hay yield loss seen in Forester was not due to disease, and more likely an effect of fungicides as the disease severity was low in this variety.
Table 7. Red leather leaf severity (% leaf area affected) and stem thickness and yield of eight oat varieties at Longerenong, Victoria, 2020.
Variety | Rating | Red leather leaf severityB (%LAA) | Stem thickness (mm) | Hay yield (t/ha) | |||||||
|---|---|---|---|---|---|---|---|---|---|---|---|
7 Sep Z51 | 15 Oct Z75 | High DiseaseC | Low DiseaseC | High DiseaseC | Low DiseaseC | Loss % | |||||
Forester | MRMS | 4 | 9 | 1.0 | 1.2* | 5.9 | 6.8** | 13 | |||
Tungoo | MRMS | 1 | 3 | 1.1 | 1.1 | 7.1 | 6.2 | 0 | |||
Brusher | MS | 7 | 29 | 1.0 | 1.2** | 7.0 | 7.3 | 0 | |||
Williams | MS | 3 | 21 | 1.4 | 1.4 | 6.5 | 7.4** | 12 | |||
Mulgara | S | 13 | 37 | 1.2 | 1.4** | 7.0 | 7.8* | 10 | |||
Yallara | SVS | 10 | 25 | 1.2 | 1.2 | 7.2 | 7.1 | 0 | |||
Winteroo | SVS | 12 | 30 | 1.0 | 1.1** | 6.4 | 7.2* | 11 | |||
Kingbale | SVS | 11 | 29 | 0.9 | 1.1** | 6.4 | 7.7** | 17 | |||
** = statistically significantly different at 1%; *= statistically significantly different at 5% when the high and low disease treatments were compared, A Forester was cut at Z65 and may have not reached its full yield potential, B Average of disease treatment. C High disease treatment = Inoculated with RLL infected stubble residue and no fungicide to determine loss; Low disease treatment = no infected stubble and foliar fungicide to determine yield potential.
Milling oat yield and quality loss
All six oat varieties had significant grain yield loss due to RLL, demonstrating its potential impact and need for management during favourable seasons (Table 8). In general, grain yield loss was related to variety rating. Williams (MS) had the lowest infection and grain yield loss, demonstrating the benefits of growing a moderately susceptible (MS) or better rated variety. Bannister (MSS) and Kowari (S) had losses of 15-16%, while Bilby (S) and Yallara (SVS) had losses of 20-21%. Mitika (SVS) had less grain yield loss than its rating would indicate, likely due to faster maturity which allowed it to avoid some of the late infection.
Table 8. Red leather leaf severity and grain yield loss of six milling oat varieties in response to high and low disease treatments at Longerenong, Victoria 2020.
Red leather leaf severity (%LAA) | Grain yield (t/ha) | |||||||
|---|---|---|---|---|---|---|---|---|
Variety | Rating | 29 Sep Z69 | 13 Oct Z75 | High DiseaseC | Low DiseaseC | Loss (%) | ||
Williams | MS | 8 | 11 | 5.5 | 5.8* | 5 | ||
Bannister | MSS | 17 | 19 | 5.1 | 6.1* | 16 | ||
Kowari | S | 17 | 14 | 4.4 | 5.2* | 15 | ||
Bilby | S | 18 | 10 | 3.8 | 4.8* | 21 | ||
Yallara | SVS | 16 | 14 | 3.7 | 4.6* | 20 | ||
Mitika | SVS | 15 | 11 | 4.6 | 5.3* | 13 | ||
*= statistically significantly different at 5% when the high and low disease treatments were compared. C High disease treatment = Inoculated with RLL infected stubble residue and no fungicide to determine loss; Low disease treatment = no infected stubble and foliar fungicide to determine yield potential.
Fungicide resistance management
Resistance to fungicides is becoming an increasing threat to cereal crops across Australia. There are five strategies that growers can adopt to slow the development of resistance in pathogen populations and therefore extend the longevity of the limited range of fungicides available:
- Avoid susceptible crop varieties. Where possible select the most resistant crops suitable and/or avoid putting susceptible crops in high risk paddocks.
- Rotate crops. Avoid planting crops back into or adjacent to the same stubble.
- Use non-chemical control methods to reduce disease pressure. Delaying sowing, early grazing are examples of strategies that can reduce disease pressure.
- Spray only if necessary and apply strategically. Avoid prophylactic spraying and spray before disease gets out of control.
- Rotate and mix fungicides/mode of actions. Use fungicide mixtures formulated with more than one mode of action, do not use the same active ingredient more than once within a season and always adhere to label recommendations.
Conclusion
In the absence of proactive disease control, yield losses due to diseases can be greater than 20%. The risk from rust diseases is likely to be greater with a wet summer (La Niña) supporting volunteer cereals that carry rust inoculum from one season to the next. It is, therefore, important that plans are developed to effectively manage cereal diseases this season. Disease management plans should consider paddock and variety selection and, where the risk warrants it, the proactive and prudent use of fungicides that avoid overuse to protect their longevity.
Acknowledgements
This work is made possible by investment from the Victorian Government (Agriculture Victoria) and the GRDC through the GRDC projects: DJP1907-001RTX, DAW1810-007RTX, DJP1905-002SAX, DJP1907-004RTX and CUR1905-001SAX. The research undertaken as part of these projects is made possible by the significant contributions of growers through both trial cooperation and the support of the GRDC, the authors would like to thank them for their continued support.
Work was also funded by The University of Sydney, project 9175448.
Thanks to Agriculture Victoria’s Cereal Pathology Team: Graham Exell, Jordan McDonald, Glenn Sluggett, Joshua Fanning, Jon Baker, Melissa Cook, Hari Dadu, Luise Fanning, Rajandeep Singh, Zoe Nicholson, Bhanu Kalia and Andrew Hallett. Thanks also to the Birchip Cropping Group for field trials within the Victorian Mallee.
Useful resources
Current Victorian Cereal Disease Guide
Cereal seed treatment guide 2020
Cereal rust reports and mapping of rust reports
Contact details
Mark McLean
Agriculture Victoria, Private Bag 260, Horsham 3401, Victoria
03 4344 3111
mark.s.mclean@agriculture.vic.gov.au
@msmclean777
Grant Hollaway
Agriculture Victoria, Private Bag 260, Horsham 3401, Victoria
03 4344 3111
grant.hollaway@agriculture.vic.gov.au
@Grant_Hollaway
GRDC Project Code: DJP1907-001RTX, DAW1810-007RTX, DJP1907-004RTX DJP1905-002SAX, CUR1905-001SAX,
Was this page helpful?
YOUR FEEDBACK