Performance of farming systems in the northern region – Cross-site analysis of economics and water use efficiency
Take home message
- Cropping system decisions can have large and ongoing consequences on system profitability – varying by up to $200/ha/yr. in gross margin generated
- Cropping intensity was the most influential driver of system productivity and profitability across most sites.
- Understanding soil water to guide crop sowing decisions is critical to maximise conversion of rainfall into profit in most locations
- Managers must account for legacy effects of different crop choices on fallow water accumulation
- There is often flexibility in crop choices, which may enable management of disease or weed problems whilst achieving similar system productivity, though there may be greater risks that need to be managed.
Introduction
Farming systems face numerous challenges to maintain their long-term sustainability and profitability. Farming systems need to evolve to be more resilient to changing climatic conditions with increasing rainfall variability, declining soil fertility and function, increasing soil-borne pathogens, increasing prevalence of herbicide resistance and problem weeds. There are also questions about how different farming system approaches will impact various farming system elements. These include: how can we maximise the capture and utilisation of rainfall? How do we reduce the risk of crop failure? How can we suppress or manage crop pathogen populations or weeds and slow the onset or prevalence of herbicide-resistant weed populations? How do we maintain the soils capacity to provide adequate nutrients to crops when they need them? How do we reduce the reliance or costs of external inputs? How do we minimise our demand on labour and overhead operating costs?
All these questions challenge the decision-making of farmers. However, because of the multi-faceted nature of these challenges, a farming systems approach is required to understand how various practices or interventions combine to affect synergies or trade-offs. There is also a need to understand how these interventions may impact the whole-of-system productivity, risk, economic performance, and sustainability of farming systems.
This paper reports on a set of long-term farming systems experiments conducted over five years across Australia's summer-dominant rainfall zone. Farming systems in this region are particularly complex, with a broad range of potential crops with a range of sowing windows in summer and winter, different soil water requirements for these crops, and the capacity to store soil water during fallows for subsequent crops. Hence, farmers have a complex set of decisions that drive the farming system, with diverse management approaches being used depending on soil and climatic environment. We established experiments comparing different system ‘strategies’ with associated decision-making rules designed to address critical current and emerging issues for farming systems to monitor how these impacted a diverse range of performance indicators.
What has been done
We established experiments in 2015 at seven locations: a core experimental site at Pampas near Toowoomba (38 systems), at three regional centres across central and southern Qld (Emerald, Billa Billa, Mungindi) and three in northern NSW (Spring Ridge, Narrabri and Trangie) each comparing 6-9 locally relevant systems. Together, this constituted 85 system × site combinations that were monitored for five years (2015 to 2020). A common set of system treatments were implemented across each regional site. At the same time, the core experiment also investigated interactions between these systems for a variety of crop rotations represented across the northern grains zone varying in their balance of summer and winter crops; i.e. summer-crop dominated (Pampas-SUM), and winter crop-dominated (Pampas-WIN) or opportunistic involving both summer and winter crop options (Pampas-MIX). A local baseline treatment (designed to represent local best practice) was compared against a set of modified farming system treatments at each site. These treatments involved altering the decision-making strategies or rules that allow the farming system to respond to the climatic and soil conditions it faces and the crop suite and management relevant at each location (outlined below). Hence, the system treatments induce different crop sequences across locations, but these are based on a common approach or rationale.
In this paper, we focus on those systems deployed across multiple sites.
- Baseline –approximates the current best practise in a region, involving sowing crops when moderate levels of soil water have been reached (i.e., 50-60% of plant-available water (PAW)) with a limited set of only main crops used (e.g., sorghum, wheat, chickpea) and fertiliser inputs budgeted to meet demands of median crop yield predictions for that sowing time and soil water status.
- High nutrient supply –replicates the Baseline except that fertiliser inputs are budgeted to meet crop yield predictions for the 90th percentile for that sowing time and soil water status.
- High legume frequency –aims to achieve at least 50% of crops grown are legumes, and preference is given to legumes with higher biomass and N fixation (e.g., fababean, lupin, field pea).
- Crop diversity –tests using a greater range of crops in rotations to manage disease threats and herbicide resistance. For example, over 50% of crops are resistant to root-lesion nematodes (Pratylenchus thornei), crop species are not repeated within two years, and crop choices should allow rotation of in-crop herbicide modes of action (e.g., by rotating broad-leaf and cereal crops).
- High crop intensity –involves sowing crops on a lower soil water threshold to increase the proportion of time that crops are growing and reducing time in fallow. In some cases, this involved adding additional crops to capitalise on double-crop opportunities (e.g., mungbeans).
- Low crop intensity –involves sowing crops only when PAW approaches maximum storage (i.e., > 80%) requiring longer fallows, but higher value crops (e.g., dryland cotton) are preferred to capitalise on the stored water.
Over the life of these experiments, we have measured a range of attributes, including soil profile water and mineral nitrogen dynamics, crop productivity, nutrient removal and utilisation, soil-borne disease inoculum loads and production inputs. This data was then used to calculate a range of performance indicators. These included profitability, risk, resource-use-efficiency, nutrient balance, pathogen populations, soil function, pesticide inputs and load, labour and machinery operation requirements. Here we present just a selection of these to illustrate the impact of some of these farming system changes and decisions.
The decision-making framework established for each farming system strategy has produced divergent choices in crop types and sequences grown, cropping intensities (or the number of crops grown), and fertiliser and other inputs at each of the sites. It is notable that these choices, and hence the effects that have resulted, are not consistent across these experiments due to differences in their climate and weather experienced, viable crop options available and soil fertility status and paddock history. Nonetheless, together there are several trends that are particularly evident across sites.
Economic performance metrics
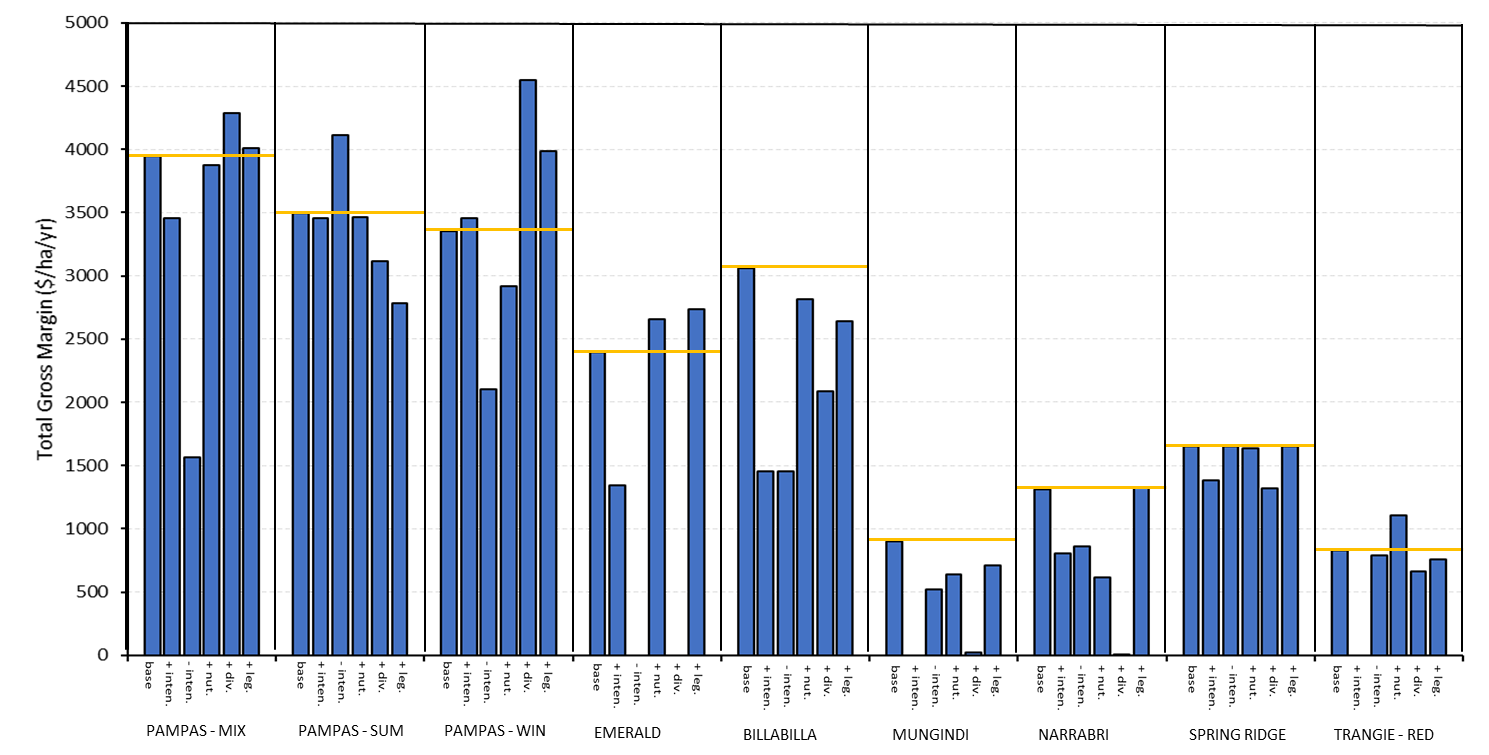
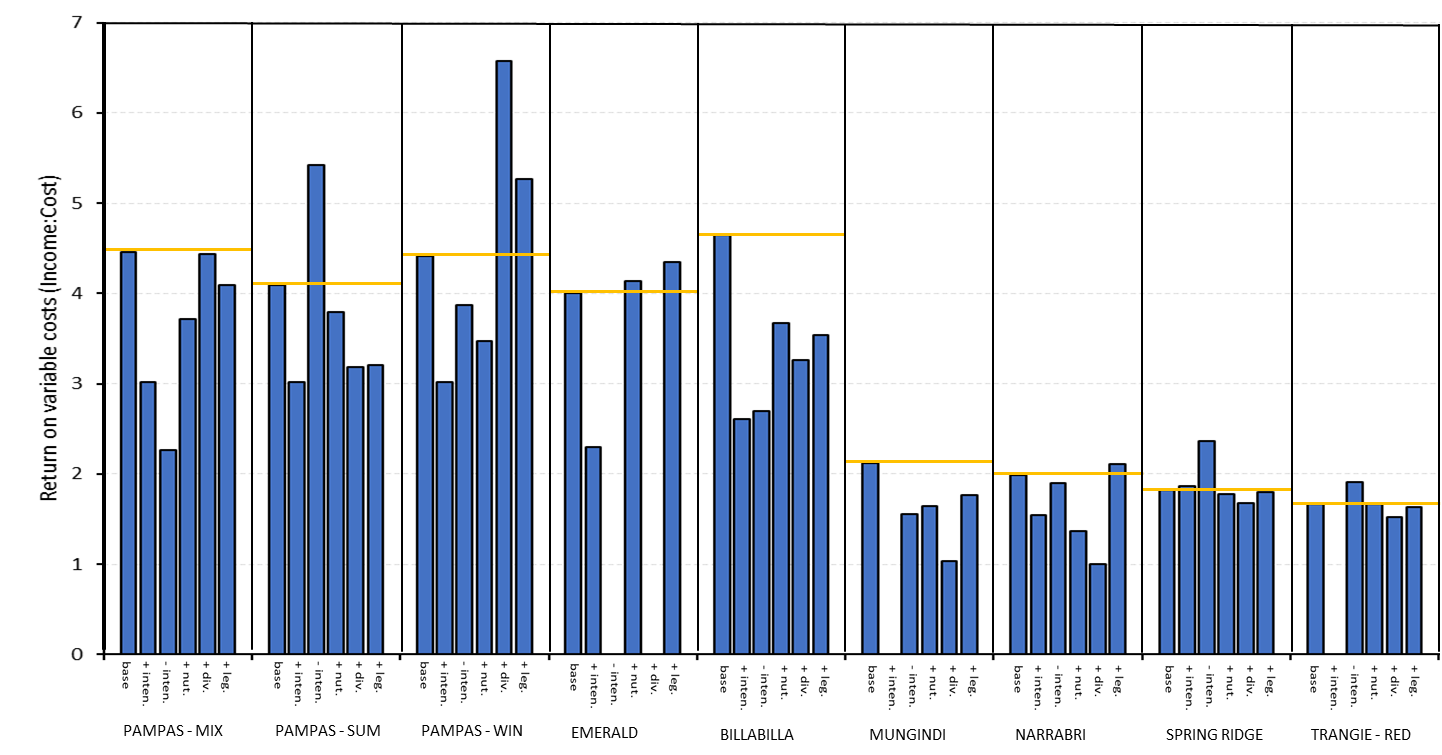
There was an extensive range in gross margin within any one site between the best and worst system: exceeding over $200/ha/yr. at most sites (Figure 1). Similarly, a wide range in return on variable costs (ROVC) was found, often varying by more than 2-fold within the site (Figure 2). However, at most sites there are a selection of systems that have generated similar gross margins (i.e., +/- 10%) indicating that several system modifications can be profitable.
At 5 of the 9 sites, one of the modified farming systems achieved significantly higher gross margins than the Baseline deployed at each site. Only at Billa Billa did the Baseline system perform significantly better than any of the other systems at that site.
When averaged across all site comparisons, the intensity of the farming system has had the most influence on profitability, producing $114/ha/yr. and $132/ha/yr. lower returns from the Higher and Lower intensity systems, respectively. Higher intensity systems often incurred significantly higher variable costs and inputs, and hence lower ROVC (Figure 2).
The High nutrient and Higher legume strategies had only slightly lower reductions on the gross margin of the Baseline strategy, on average ($-35/ha/yr. and $-15/ha/yr., respectively). This lower margin was attributable to the higher inputs of fertiliser in the High nutrient strategy. With dry seasonal conditions predominating across these experimental years, only two crops had a significant yield response to higher fertiliser inputs. These two cases were the two locations where the High nutrient strategy increased gross margin and achieved equal ROVC, indicating that this strategy may have resulted in the more favourable outcomes over the long term with more favourable seasonal conditions.
 Figure 1. Gross margins generated over 6 years (2015-2020) across different farming systems deployed at each of 9 experimental comparisons spanning the northern grains region including 6 regional sites and the core site (Pampas) with different seasonal crop dominance (Summer-dominant – SUM, Winter-dominant – WIN, and Mixed opportunity – MIX). Yellow lines indicate the baseline system at each of experimental sites compared to modified system strategies.
 Figure 2. Ratio of income relative to variable costs incurred over 6 years (2015-2020) across different farming systems deployed at each of 9 experimental comparisons spanning the northern grains region including 6 regional sites and the core site (Pampas) with different seasonal crop dominance (Summer-dominant – SUM, Winter-dominant – WIN, and Mixed opportunity – MIX). Yellow lines indicate the baseline system at each of experimental sites compared to modified system strategies.
A somewhat surprising result was that the high legume systems incurred higher variable production costs due to higher pesticide costs and also increased fertiliser input requirements. This was surprising as it was expected the legumes would reduce N fertiliser needs but due to the significant depletion of soil mineral N and high yielding crops exporting large amounts of N from the system, additional N was often needed in subsequent crops. Finally, increasing crop diversity as a strategy to manage biotic threats had highly variable outcomes across sites, but on average, it achieved a $74/ha/yr. lower gross margin.
System water use efficiencies
The efficiency with which water is used across the farming system has been a central focus of this research; that is, to characterise the income generated per hectare per mm of rain and how this is influenced by the farming system. We have been collecting data to understand how different production systems such as the mix of crops grown and the intensity of the system influence different aspects of the capture and utilisation of rainfall and how efficiently this is converted into crop yield and profit. Below is a calculation that separates the critical elements that drive system WUE. The efficiency of fallows and the proportion of rain that occurs during fallows drives the amount of water that is accumulated before sowing, which is then complimented by in-crop rain. Together this constitute the amount of water available for the crop to use. The efficiency that the crops then convert this into product and the value of this contributes to the total systems WUE.
System WUE ($/ha/mm)= Crop WUE x [(Fallow efficiency × rainfallow) + rainin-crop] × Price
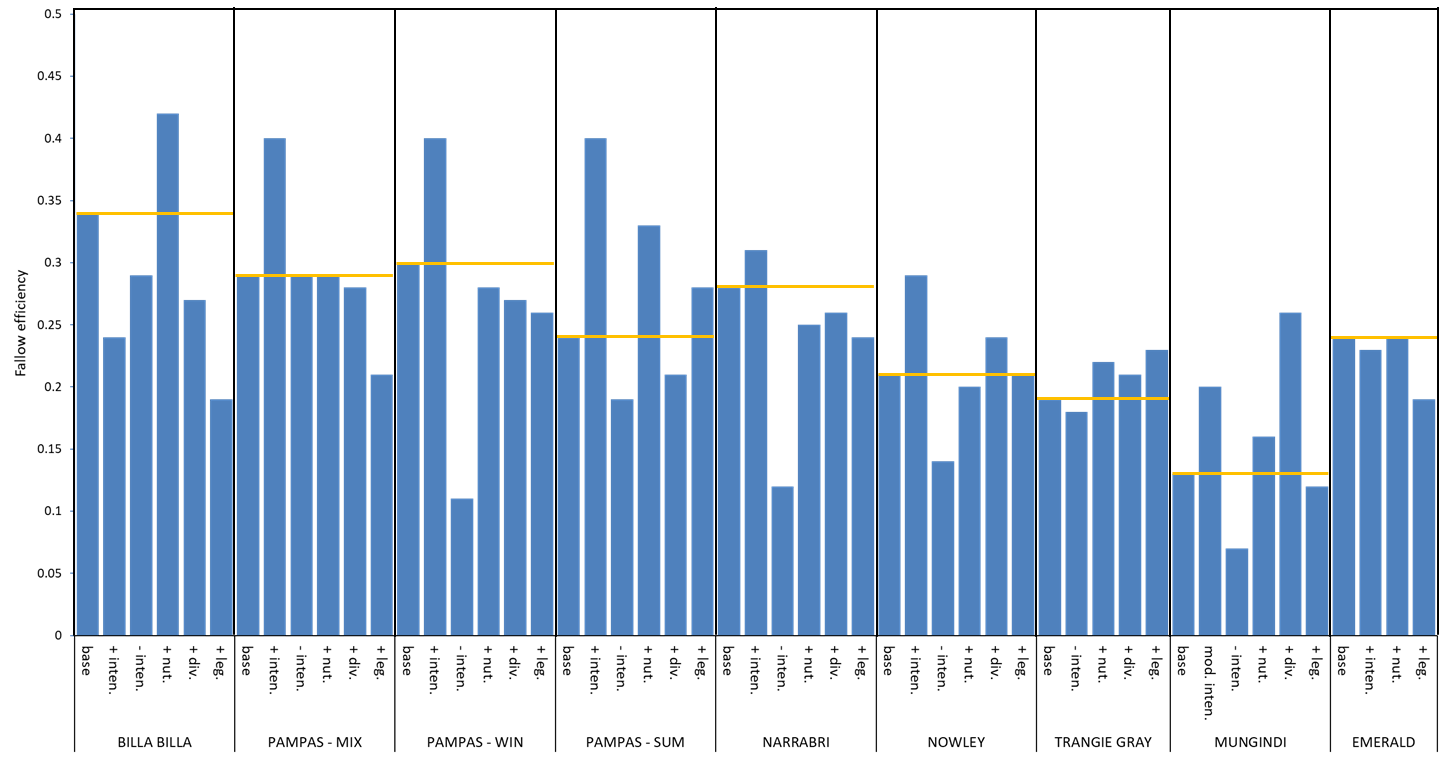
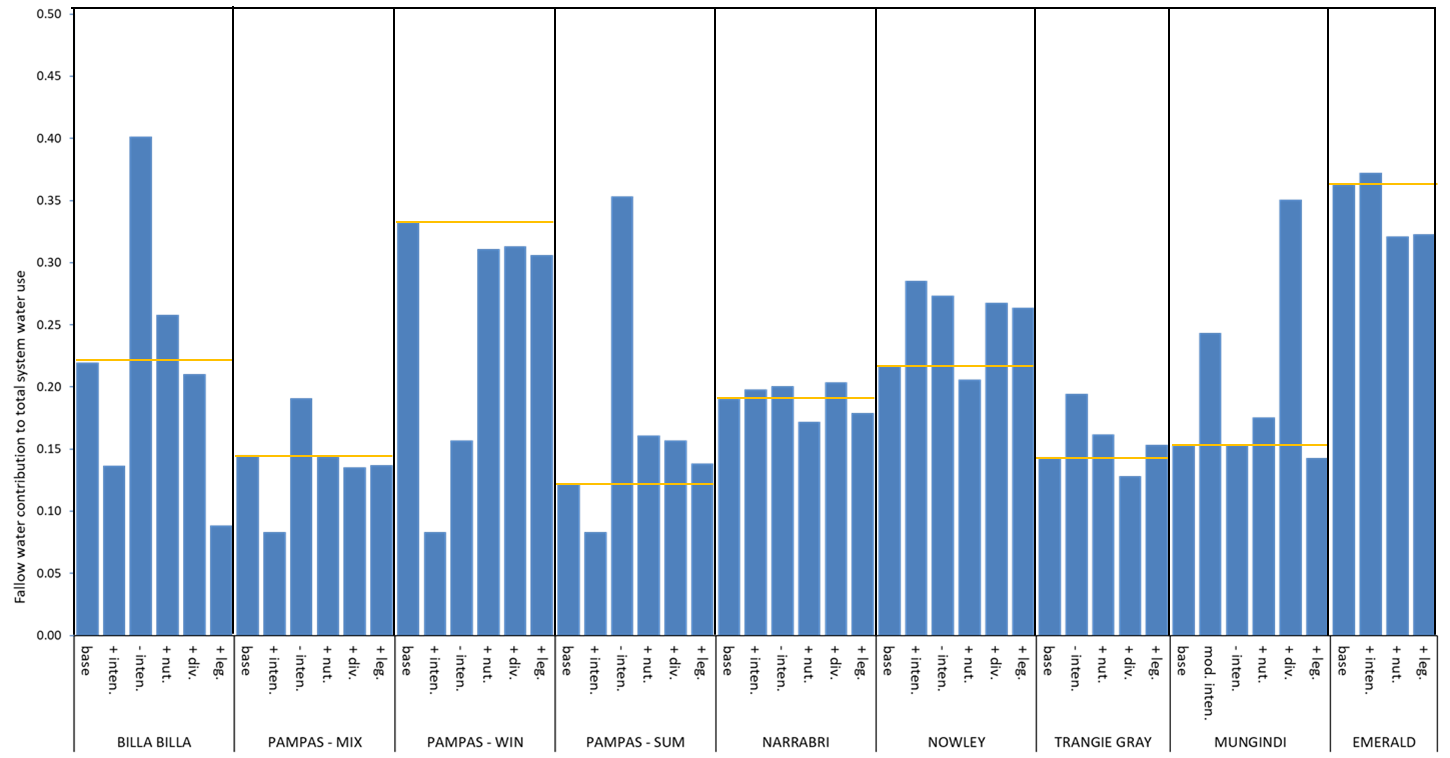
Across our experiments we have consistently demonstrated that Higher crop intensity systems generally increased fallow efficiency and rainfall capture, but because crops were sown with less accumulated soil water, these systems were more reliant on in-crop rainfall. Hence, the water was often not used most efficiently to produce profitable crops, due to lower crop water use efficiencies. Lower intensity systems often reduced the efficiency of fallow rainfall accumulation due to longer fallows with lower ground cover (Figure 4). Higher legume systems also generally had lower fallow efficiencies, due to lower and less persistent ground cover provided by legume crops. Pulse crops often had more residual moisture left at crop harvest compared to cereals.
 Figure 3. Efficiencies of fallows (i.e., the ratio of soil water accumulated to rainfall occurring over a fallow) across different farming systems after six years (2015-2020) across the 6 regional sites and the core site (Pampas) with different seasonal crop dominance (Summer-dominant – SUM, Winter-dominant – WIN, and Mixed opportunity – MIX). Yellow lines indicate the baseline system at each of ten experimental sites compared to modified system strategies.
 Figure 4. Proportion of crop water use contributed by soil water at sowing accumulated during fallows in the different farming systems over six years (2015-2020) across the 6 regional sites and the core site (Pampas) with different seasonal crop dominance (Summer-dominant – SUM, Winter-dominant – WIN, and Mixed opportunity – MIX). Yellow lines indicate the baseline system at each of ten experimental sites compared to modified system strategies.
Across the full data set we have been able to show distinct differences in fallow efficiencies following different crop types. This has clearly shown lower fallow efficiencies after winter pulse crops such as chickpea, fababean or fieldpea. This is due to the lower and less persistent ground cover they provide. Similarly, sorghum and other summer crops have also had lower fallow efficiencies when compared to winter cereals (see Table 1).
Table 1. Efficiencies of fallows following different prior crop types and over short or long fallows.
(n = the number of fallow monitored contributing to the median reported)
Previous crop | Median | n | Short fallow(<8 months) | n | Long fallows(> 8 months) | n. |
|---|---|---|---|---|---|---|
Winter cereals (wheat, durum, barley) | 27% | 106 | 34% | 62 | 21% | 36 |
Winter pulses (chickpea, fababean, field pea) | 16% | 54 | 17% | 29 | 14% | 17 |
Sorghum | 19% | 43 | 27% | 8 | 19% | 35 |
Cotton/maize/sunflower | 17% | 19 |
Implications for growers
This research has demonstrated that farming systems decisions such as the soil water required for sowing and crop choice are critical drivers of profitability. These can result in large differences in gross margin and return on input costs. Hence, understanding the implications of these decisions on multiple aspects of the farming system is critical. The intensity of the farming system (the proportion of time when crops are growing) and the associated reliance on in-crop versus soil water accumulated during fallows is a significant driver of many performance indicators. Therefore, understanding soil water availability and factors influencing its accumulation and utilisation (e.g. ground cover) is vital information required to make better decisions that ultimately result in improved system profitability over the long term.
Acknowledgements
We would like the thank the local growers and consultants who have actively supported and continue to contribute towards this project. The CSIRO staff who assist in data management and consistency across all sites and the broader Research Agronomy team in Emerald, Toowoomba, and Goondiwindi.
We would also like the thank the Grains Research and Development Corporation, along with the Department of Agriculture and Fisheries in Queensland and the Department of Primary Industries in New South Wales and the CSIRO who have supported this long-term project. The research undertaken as part of this project is made possible by the significant contributions of growers through both trial cooperation and the support of the GRDC, the author would like to thank them for their continued support.
Contact details
Lindsay Bell
CSIRO
Ph: 0409 881 988
Email: Lindsay.Bell@csiro.au
GRDC Project Code: DAQ1406-003RTX, CSP1406-007RTX, DAQ2007-002RTX,
Was this page helpful?
YOUR FEEDBACK
