Swathing Mungbeans – is it an alternative desiccation method in mungbeans?
Author: Doug Sands (Queensland Department of Agriculture and Fisheries), Jayne Gentry (Queensland Department of Agriculture and Fisheries) & Cameron Silburn (Queensland Department of Agriculture and Fisheries) | Date: 17 Nov 2021
Take home message
A one year proof of concept swathing trial indicated:
- Mechanical desiccation (swathing) produces similar yield, quality and screening results to chemical desiccations, if it is applied when the crop has 90% of its pods at physiological maturity
- Mechanical desiccation causes the plant material to dry down much faster than chemical desiccations
- Mechanical desiccation produces the best results when it is harvested within 7 to 10 days of application.
Introduction
Currently Australian mungbeans are chemically desiccated prior to harvest to aid in dry down of the crop and facilitate mechanical harvest. The main product used is glyphosate. With the improvement in mungbean varieties resulting in more vigorous plants, desiccation has become increasingly problematic. At the same time, mungbean export markets are becoming increasingly sensitive to pesticide maximum residue limits (MRL’s).
There was anecdotal evidence in 2019 that mechanical desiccation of mungbeans, also known as swathing/windrowing, could be used for drying down the crop in place of herbicide. Growers and industry are starting to examine alternatives to chemical desiccation. The Mungbean Agronomy Project implemented a series of small plot trials across the northern region (Emerald, Warwick and Narrabri) designed to determine the ideal timing for mungbean desiccation using mechanical desiccation to maximise yield and grain quality and how this compares with chemical desiccation.
Experimental outline
A trial block of Jade AU mungbeans was planted at the Emerald Research facility on the 26th of February 2020 on 50 cm rows. The trial had 12 treatments (see below), four replicates, plot size of 6 x 36m a in a randomised complete block design. The 12 treatments were broken up into three maturity stages.
- 30% of pods had reached physiological maturity (30%PM)
- 60% of pods had reached physiological maturity (60%PM)
- 90% of pods had reached physiological maturity (90%PM)
At each maturity stage, desiccation treatments were applied selected from the following options. Not all treatments were applied at all maturity stages.
- Glyphosate at the recommended rate (Gly)
- Glyphosate at double the recommended rate (Dbl Gly)
- Diquat at the recommended rate (Diq)
- Mechanical swathing (Mech)
- Control / no desiccation applied. (There are four separate control treatments – one for each of 30, 60 and 90% PM and a fourth control plot which was used to measure ongoing development of crop maturity.
The final list of treatments for each replicate are in Table 1.
Table 1. List of desiccation treatments applied
Treatment number | Treatment label |
|---|---|
T1 | 90% PM - Gly |
T2 | 60% PM - Gly |
T3 | 30% PM - Gly |
T4 | 90% PM - Diq |
T5 | 90% PM – Dbl Gly |
T6 | 90% PM - Mech |
T7 | 60% PM - Mech |
T8 | 30% PM - Mech |
T9 | Ctrl - 30% PM |
T10 | Ctrl - 60% PM |
T11 | Ctrl - 90% PM |
T12 | Ctrl |
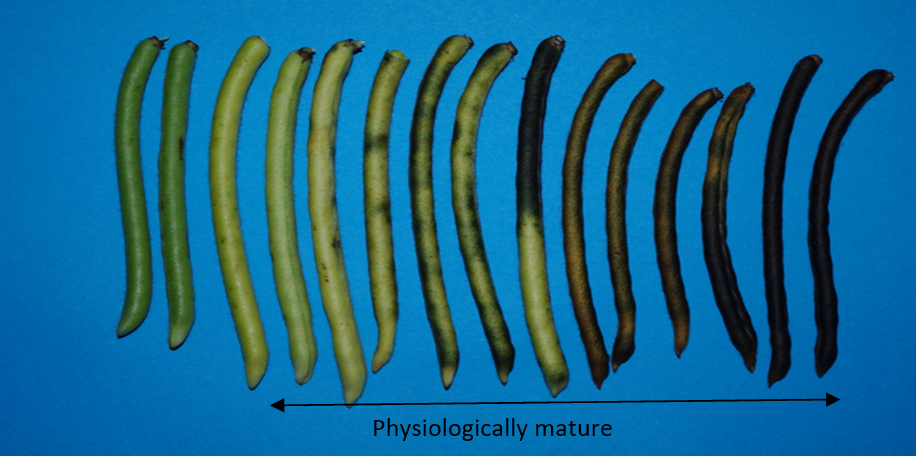
The extra control plot added in as treatment 12 (T12) was used as a monitoring plot for measuring the stage of maturity. Once the first pods were judged to be mature (Figure 1), twice weekly counts were done on a two-metre length of row in T12 to ascertain the number of mature pods (Figure 1) as a percentage of the total pod load. Assessments of pod maturity were based on a photographic standard (Figure 1).
Within each plot a series of 6 samples were taken at set times after treatments were applied. Each sample consisted of a 2 x 2m² quadrat of plant material taken from the middle of each plot. Samples were taken at random positions along the full length of the plot with at least a 1m spacing of undisturbed plant material maintained between each sample position. One sample was used to test the moisture of the plant material, with the other sample threshed to obtain grain yield.
Sampling took place at set days after treatment (DAT) which included 0, 3, 7 (Figure 2 and 3), 10, 14 and 20 DAT. At 0 DAT, only the control plots were sampled, as this was the day when the chemical and mechanical desiccation treatments were being applied. The control treatments were used to identify the natural dry down of the crop when no desiccation treatments were applied.
Grain collected from threshed samples was used to determine grain yield, with screenings determined by using a 3.25 mm screen to separate out any material that could be considered as harvest screenings (mainly split seed and small seed). The cleaned grain sample was then used to assess grain quality and herbicide residue.
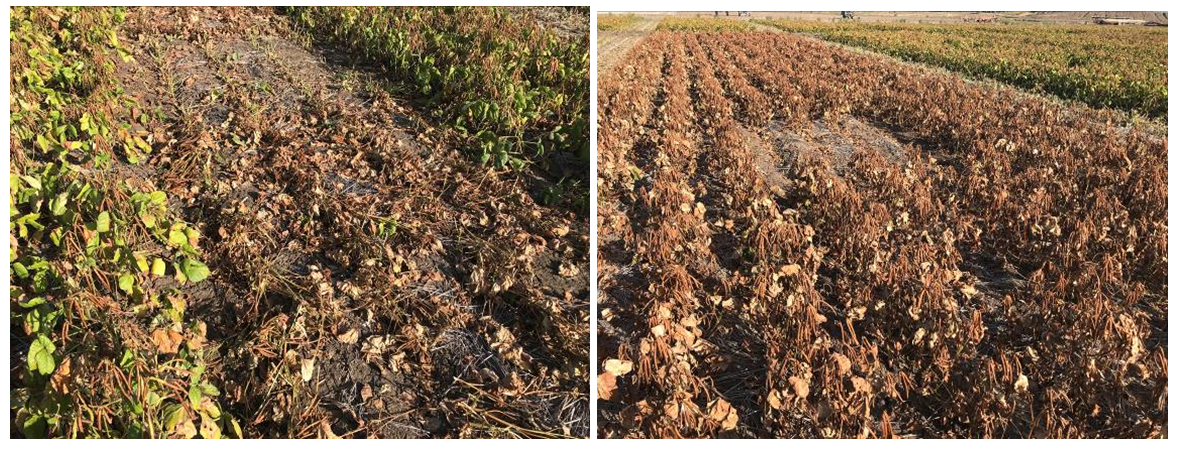
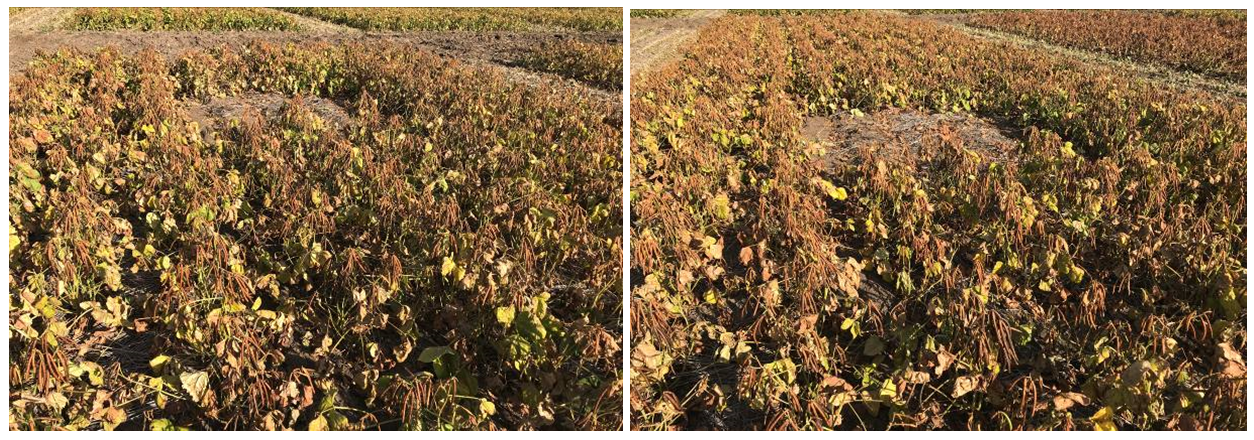
rate in 90%PM (right), at 7 days after treatment.
Results
The differences between desiccation treatments were assessed using several parameters including recoverable grain yield, rate of plant dry down, harvest screenings, total dry matter yield, harvest index, grain quality and in-field grain losses. Not all assessments were completed by the time of publication. As a result, this paper will focus on recoverable grain yield, whole plant moisture loss, harvest screening and quality ratings.
Recoverable grain yield
Table 2. Mean grain yield measured across all treatments for each sampling interval standardised to 12.5%MC (DAT)
Days after treatment (DAT) | Treatments | |||||||
|---|---|---|---|---|---|---|---|---|
30%PM | 60%PM | 90%PM | ||||||
Mech | Gly | Mech | Gly | Mech | Gly | Dbl Gly | Diq | |
3 | 1539 | 1630 | 1502 | 1526 | 1765 | 1461 | 1477 | 1569 |
7 | 1420 | 1582 | 1537 | 1341 | 2070 | 1972 | 2038 | 1894 |
10 | 1412 | 1606 | 1575 | 1641 | 1832 | 1917 | 2012 | 1850 |
14 | 1244 | 1704 | 1333 | 1730 | 1281 | 1654 | 1888 | 1410 |
20 | 1250 | 1676 | 1316 | 1438 | 1491 | 1851 | 1807 | 1681 |
LSD | 343 | |||||||
The grain yield data (Table 2) shows the highest recoverable yield (2070 kg/ha) was for mechanical swathing, 7 days after cutting, when the crop was at 90% physiological maturity (PM). This yield was not significantly different to any of the other three treatments used at the 90%PM stage at day 7 or day 10 assessment intervals (Table 2). This suggests that differences in harvest efficiency between mechanical and chemical desiccation is negligible when done at the optimum timing.
There are some differences in the grain yield data that need to be highlighted. Firstly, a direct comparison between mechanical desiccation and the recommended rate of glyphosate, shows grain yield reducing significantly in the mechanical desiccation treatments after day 10 (Figure 4) compared to the glyphosate treatments. This means glyphosate desiccation has an advantage over mechanical desiccation the longer that harvest is delayed after treatment.
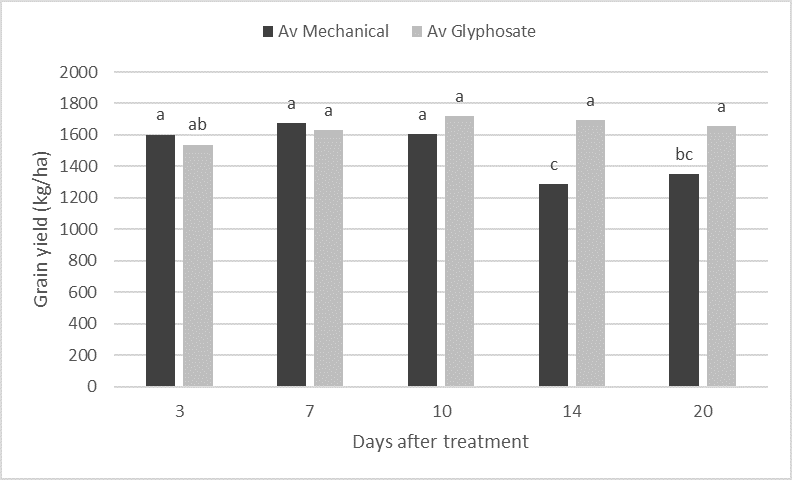 Figure 4. Comparison of mechanical and glyphosate desiccation treatments by mean grain yields measured across all PM stages (lsd = 199, P=0.05)
The yield data also indicates that there are significant differences in yield depending on what PM stage of the crop the desiccation treatments are applied (Figure 5). Yield recovery at 90PM was significantly higher at 7, 10 days after treatment compared to 30%PM and 60%PM.
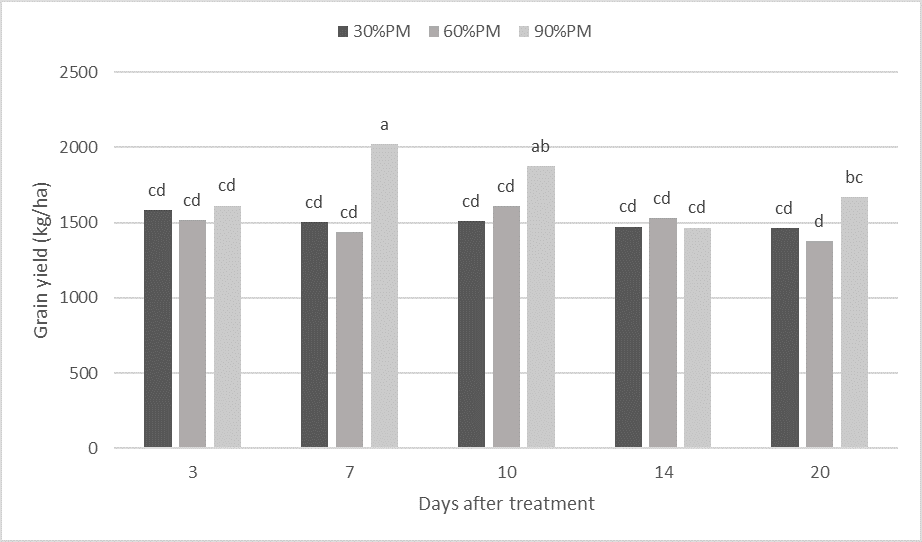 Figure 5. Comparison of mean grain yields across maturity stages at each sampling interval
(lsd = 244, P=0.05).
Data from just the 90%PM stage shows no significant differences between chemical and mechanical desiccation until day 14 sampling. Control treatments in the 90%PM (Figure 6) had the opposite response compared to the desiccated treatments; demonstrated by lower yields in the early sampling period and then some improvement in the later sampling. This may coincide with the advancing crop maturity making pods easier to thrash out despite no defoliation applied.
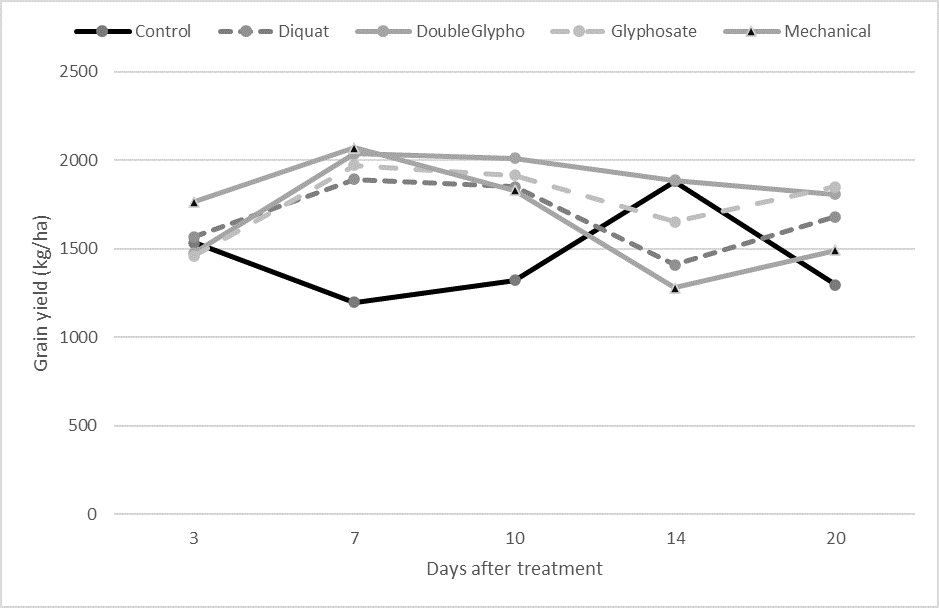 Figure 6. Comparison of mean grain yields from each sampling interval across treatments within the 90%PM stage including control plots (lsd = 357, P=0.05)
Whole plant dry down
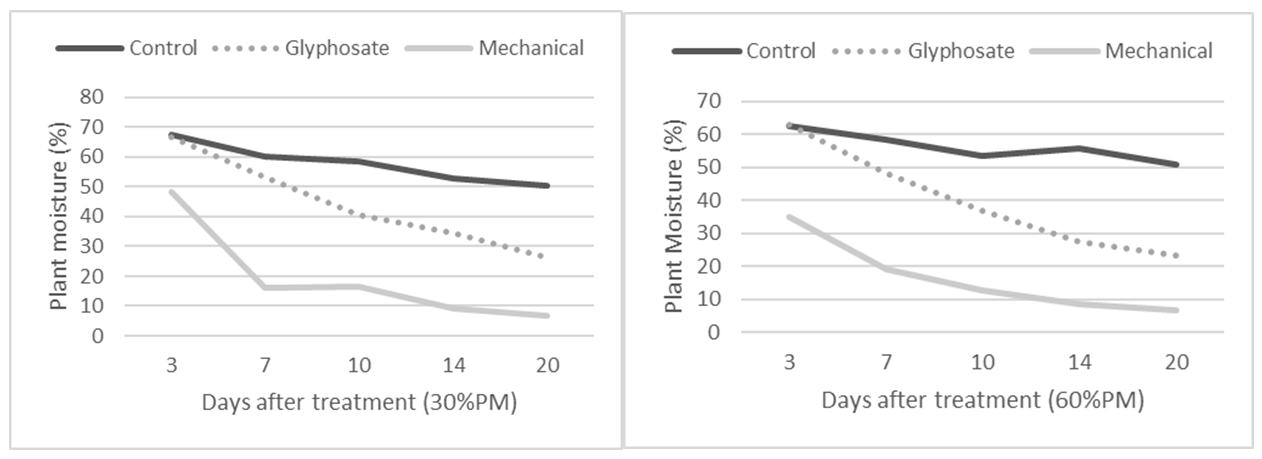
The rate of crop dry down changed significantly between chemical and mechanical desiccation across all stages of maturity (Figures 7 and 8). The 30%PM and 60%PM stages of crop maturity (Figure 7) shows a much more rapid dry down in plant material for mechanical desiccation compared to the glyphosate application. Within 7 days the mechanical treatment is under 20% moisture content (MC), while the glyphosate treatment is still at 50% MC which is only 10% under the control treatment (Figure 7). By day 20 the glyphosate treatments still have 20 – 30 % MC whereas the mechanical treatments are under 10 % MC. At 14DAT and 20DAT the yield recovery for the mechanical desiccation treatment was significantly reduced (Figure 4); one of the reasons for this could be because the plant material is under 10% MC (Figure 7) and has become very brittle which increases the number of pods beings lost on the ground during harvest.
The advancing maturity of the crop is demonstrated by the changes in starting crop moisture content (MC) for each maturity stage (Figures 7 and 8).
- 30%PM - ~70% MC
- 60%PM - ~60% MC
- 90%PM - ~50%MC
At 90%PM (Figure 8), diquat provides a quicker dry down than either glyphosate treatment but is still significantly slower than mechanical desiccation. It is interesting to note that at the 90%PM stage, both the glyphosate and the mechanical desiccation treatments get to similar plant moisture contents by the last day of sampling, which was not the case at earlier maturity stages (Figure 7). The data also shows that diquat did not dry the crop down as far as glyphosate did at the end of the sampling period. This aligns with how diquat works as a contact desiccant and while it kills the leaf, it does not necessarily kill the plant, so allowing plant stems to potentially retain moisture.
At 90%PM, the mechanical desiccation treatment reaches 10-20% MC from day 7 to day 10 (Figure 8) where yield is maximised (Figure 4 and Figure 5) and then reduces its yield recovery in days 14 - 20 where plant moisture is below 10 %. Optimising the yield recovery from mechanical desiccation may depend on being able to thrash the plant material before whole plant moisture drops below 10 % MC.
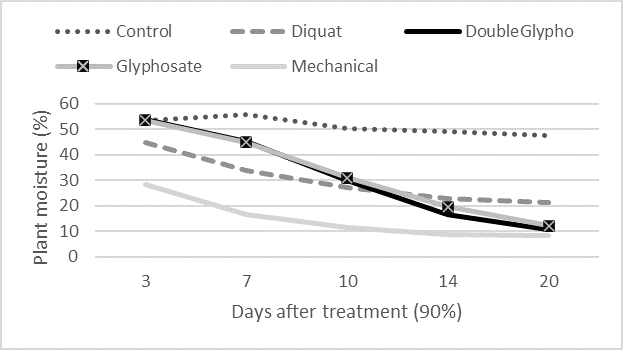
Figure 8. Mean sample moisture content taken at each sample interval for all treatments in the 90%PM stage (lsd = 3.42, P=0.05).
Harvest screenings
All yield samples were put through a 3.25mm screen to assess the proportion of small grain and split seed. Screenings were weighed and expressed a % of total grain yield. The screening percentage is associated with small seed that has not had time to mature (sampled too early in its development) or split seed that might indicate that the grain is very weathered and dry and more susceptible to splitting during harvest.
The screening data across maturity stages shows a general uniformity of screening losses for the mechanical treatments (Figure 9) except at 3DAT. The glyphosate treatments across maturity stages are quite variable (Figure 9). Between 7DAT and 10 DAT the screenings are minimised in all treatments. At 14DAT and 20DAT the screening losses start to increase in nearly all treatments but particularly in the mechanical desiccation treatments (Figure 9). This could be because the much dryer plant material (Figure 7) in the mechanical desiccation is indicating much dryer grain which can be the fore runner to more split grain during harvest.
By day 20 of sampling, the screening data (Figure 9) starts to significantly spread again which may be because the plant material is much dryer and has been weathered for longer which increases split seed, particularly in the mechanical desiccation treatments.
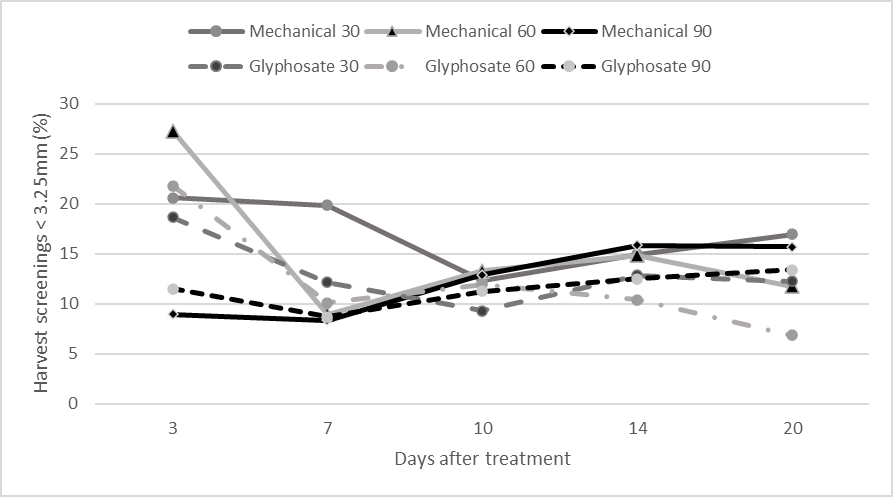 Figure 9. Comparison of mean harvest screening percentage between glyphosate and mechanical desiccation treatments across maturity stages and sampling intervals (lsd = 3.38, P=0.05)
Data from the 90%PM stage (Figure 10) shows no significant differences in screenings between the chemical and mechanical desiccation treatments. The data also shows a general increase in screenings across all treatments in the later sampling stages (Figure 10).
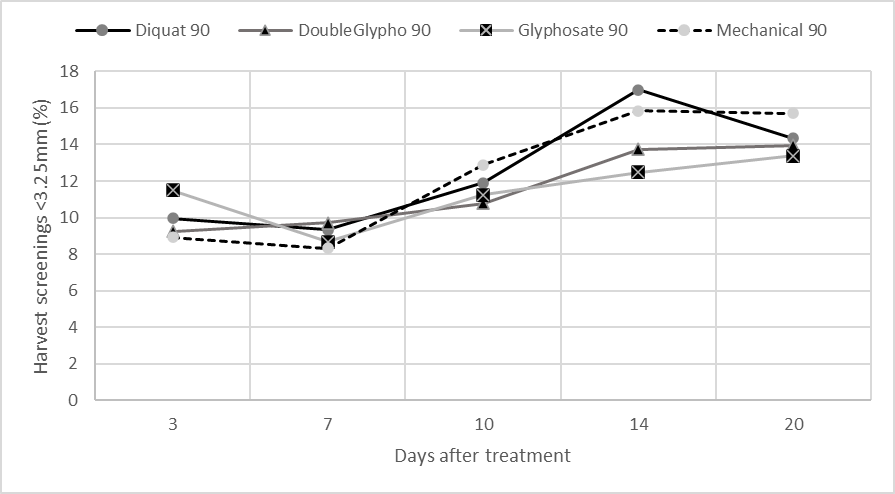 Figure 10. Comparison of mean harvest screening percentages between all treatments in the 90%PM stage at each sampling interval (lsd = 3.38, P=0.05).
Quality assessments
Seed samples from each sampling interval were assessed on commercial industry quality parameters. Based on these assessments a uniform ranking scale was used to give each sample a numerical value (Table 3).
Table 3. Allocation of ranking scale to each quality assessment level for mungbeans
Seed category | Rating scale | Grain quality ranking scale |
|---|---|---|
N=No.1 Processing | N1 | 11 |
N2 | 10 | |
P=Processing | P1 | 9 |
P2 | 8 | |
P3 | 7 | |
M=Manufacturing | M1 | 6 |
M2 | 5 | |
M3 | 4 | |
BM=Below Manufacturing | BM1 | 3 |
BM2 | 2 | |
BM3 | 1 |
The quality assessment data from each of the maturity stages shows the mechanical swathing produces a relatively consistent quality of seed across all sampling intervals (Figure 11 and 12). Chemical desiccation with glyphosate led to some inconsistent quality results, although generally the pattern of response in the first two maturity stages (30%PM and 60%PM) was lower quality when harvest samples were taken soon after treatment, with quality improving the longer the harvest was delayed (Figure 11).
The quality results from the 90%PM stage shows the most consistent data with little significant differences between desiccation treatments and timing of harvest (Figure 12). Nearly all the quality results were in a small range between 8 to 10 on the quality scale (middle quality processing to No. 1 processing). This result demonstrates that mechanical swathing will not negatively impact on the quality of the beans compared to chemical desiccation particularly if applied at the 90%PM stage of the crop.

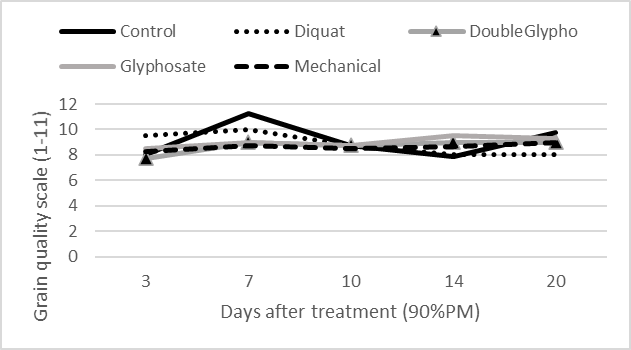 Figure 12. Mean grain quality ratings taken at each sample interval for all treatments in the 90%PM stage (lsd = 1.52, P=0.05).
Summary
It is important to note that this data is from one trial only based in CQ and with a set of environmental conditions that were favourable for harvesting. There is data still to be processed and assessed such as in-field grain losses which will be critical in the assessment of mechanical desiccation. Thus conclusions from what has been presented in this paper is only preliminary and will need to be revisited.
Based on yield recovery data, harvest screenings and quality assessments; mechanical desiccation was not significantly better or worse than using currently recommended chemical desiccations if harvest occurred within 7-to-10-days. This timing is crucial given the rapid dry down that occurs when mechanical swathing is applied and the possibility of plant material becoming too dry (below 10 %) which leads to pods falling off the plant during harvest. This is indicated by the increase in screenings when threshing was left to day 14 or later. Yield recovery was far better for both desiccation methods in the 90%PM stage of maturity which is currently what is recommended commercially.
The glyphosate treatments showed comparable yield recovery to mechanical desiccation at 3DAT, 7DAT and 10DAT.
Quality results also reinforce that mechanical swathing did not negatively impact on the quality of the beans compared to chemical desiccation. The best and most consistent quality data came when applying desiccation treatments at the 90%PM stage of the crop.
It should be noted that this experiment along with similar experiments carried out at Warwick and Narrabri were done under field experiment conditions with swathing and harvest process done by hand not with commercial equipment. Results may change when commercial scale equipment is used.
Acknowledgements
This research was undertaken with in kind support from the Australian Mungbean Association (AMA) and Paul McIntosh (Pulse Australia).
AgEtal has provide significant in-kind support to this project particularly for the quality assessments that were needed as a major part of the data collected from these experiments.
The research undertaken as part of this project is made possible by the support of GRDC, the author would like to thank them for their continued support.
The author would also like to acknowledge the critical support from the technical officer staff involved in this trial including Penny Borger and Peter Agius.
Contact details
Douglas Sands
Queensland Department of Agriculture and Fisheries
99 Hospital Road, Emerald 4720.
Ph: 0457 546 993
Email: douglas.sands@daf.qld.gov.au
Varieties displaying this symbol beside them are protected under the Plant Breeders Rights Act 1994.
GRDC Project Code: DAQ1805-003RTX,
Was this page helpful?
YOUR FEEDBACK
