How well does assessment of outer florets of a wheat head following frost(s) relate to grain yield at the end of the season?
Author: Brenton Leske and Ben Biddulph, Department of Primary Industries and Regional Development | Date: 03 Mar 2022
Key messages
- Proximal grains in wheat spikes are key determinants of grain yield when exposed to frost, but distal grains can play a minor role in compensation if the season permits.
- Measurement of frost damage should continue to include an assessment of sterility of proximal florets to determine the extent of damage to wheat crops.
- To determine the contribution made by all grains in the wheat spike to grain yield when damaged by frost.
- To compare grain set and grain size in cultivars with known differences in their performance under frost after spike emergence.
Aims
- To determine the contribution made by all grains in the wheat spike to grain yield when damaged by frost.
- To compare grain set and grain size in cultivars with known differences in their performance under frost after spike emergence.
Introduction
Accurate assessment of frost damage is critical when making decisions about salvage options for frosted crops. Previous advice to growers has been to check crops for symptoms of damage 5–7 days after a frost event and to open glumes to determine if there has been damage to the anthers, ovules and/or developing grains. The same inspection is carried out again 5–10 days later to determine if the damage has progressed (Rebbeck and Knell 2007). Performance of wheat and barley cultivars under frost has been quantified by measuring damage in the two outermost florets (i.e., proximal grain positions) within the spike (Biddulph et al 2015; GRDC National Frost Initiative 2019). The aim of this experiment was to determine the contribution of the two outermost florets to total spike grain weight and establish if this measurement of frost damage can capture frost damage adequately.
Method
Field experiments were conducted at the DPIRD research site at Dale, Western Australia over the 2018 and 2019 seasons (32°12’24.48” S, 116°45’31.32” E). The field plots (1.7 x 5m) of 15 wheat cultivars consisted of six rows, 250mm apart. Plots were arranged in a randomised block design with three plot replicates (sub-blocks) per TOS block (main block) (Cocks et al 2019).
To expose material to natural frost, each of the trials was established with eight times of sowing (ToS) blocks based on a predicted equidistant thermal time of ~250 growing degree days from early April to early June. This was done so that wheat would be at anthesis from July to October; the frost window for the region is from August to September.
The soil was a grey sandy loam (pH 5.4 CaCl2 0-10cm). To reduce the confounding effects of stubble in altering frost damage (Smith et al 2017), stubble was burnt before sowing. One 20mm application of irrigation was applied two weeks before sowing to ensure germination. Seed was sown at 75kg/ha to achieve a target plant density of 150 plants/m. Each TOS block was fertilised at sowing with 12kg N/ha as a compound fertiliser (at 120k/ha of Gusto Gold, Summit Fertilizers) and 23kg N/ha as urea. Two additional applications of liquid fertiliser at 19kg N/ha were applied at tillering and booting stage as urea ammonium nitrate.
In season measurements
Frost damage was evaluated by assessing sterility in proximal florets, developing grain maps to determine the distribution of grains across the spike, and measuring yield and yield component traits. Zadok scores were recorded weekly from flag leaf emergence (Z39) to the end of anthesis (Z69) (Zadoks et al 1974) with 50% heading (Z55) and 50% anthesis date (Z65) then estimated from these scores (Zheng et al 2013). Floret sterility is the reduction in proximal (G1 and G2) grain number per spike expressed as a percentage of the total number of possible grains that could have formed in the proximal position within the floret. When the spikes reached medium milk stage (Z75), 30 primary tillers were collected and the floret sterility of the two proximal florets was determined after discarding the top and bottom florets (Cocks et al 2019).
At anthesis (Z65) and physiological maturity (Z87), 25cm of crop row was hand-cut above ground level from each of the four inner plot rows, dried at 70°C for 48 and 36 hours (respectively) and weighed. Anthesis cuts were not taken in 2018 Heater+ plots as the removal of biomass would have influenced the canopy air movement in the plot and the amount of radiation entering the plot and soil surface during the day. Tillers were counted to determine spikes/m2, then carefully threshed to determine harvest index (HI). A total of 30 main stem spikes per plot were sampled for floret sterility measurement during grain fill (Z75) (Cocks et al 2019). Harvest Index (HI) for TOS 5 in 2018 could not be determined due to missing data. From the HI samples, 15 to 20 primary spikes per plot were sub-sampled for grain mapping. Mapped grains were dried at 60°C for 48 hours. Grains were mapped following the procedure described in Bremner and Rawson (1978) and Leske et al (2019). In addition, grain set was mapped on one side of the spike in lots of five spikes (three pseudo replicate subset groups x five spikes in 2018 and four pseudo replicate subset groups x five spikes in 2019). Grain set data are presented as a proportion of grains present in each grain and spikelet position from the five spikes mapped x three pseudo-replicates x three plot replicates. Grain yield and yield components were determined from the whole plot (1.7 x 3m, with one metre removed from each end of the plot to eliminate edge effects) using a small plot harvester with settings optimised to retain the small frost-affected grains.
Results
Frost events
Sterility values were much higher for plots sown from mid-April to late May in 2018 and 2019 when a frost event coincided with heading and anthesis of Wyalkatchem, Scout and Cutlass (from August to October) (Figure 1). Between July to October in 2018 and 2019, there were 22 and 33 natural frost events (screen temperature ≤ 2°C) respectively; the duration of frost events was shorter in 2018 than 2019. The year 2019 was characterised by more events with lower minimum temperatures and longer chilling duration (i.e., the cumulative duration < 5°C screen temperature) compared to 2018. Frost events in both seasons caused significant floret sterility damage (20–60%). Grain frost damage was also measured in the early April sowing of Scout and Wyalkatchem in 2018 and 2019. There were no frost events or high temperature stress events at the end of either season. The absence of late environmental stress resulted in less floret sterility damage even when susceptible genotypes such as Wyalkatchem (data not sown) were sown later (mid-May and June). The maximum temperature did not exceed 28°C from July to September 2019 and only six days were above 25°C during the anthesis period (data not shown). Since pollen sterility occurs at temperatures >30°C, this provides evidence that the floret sterility present in spike samples was due to frost and not another abiotic stress such as heat or terminal drought.
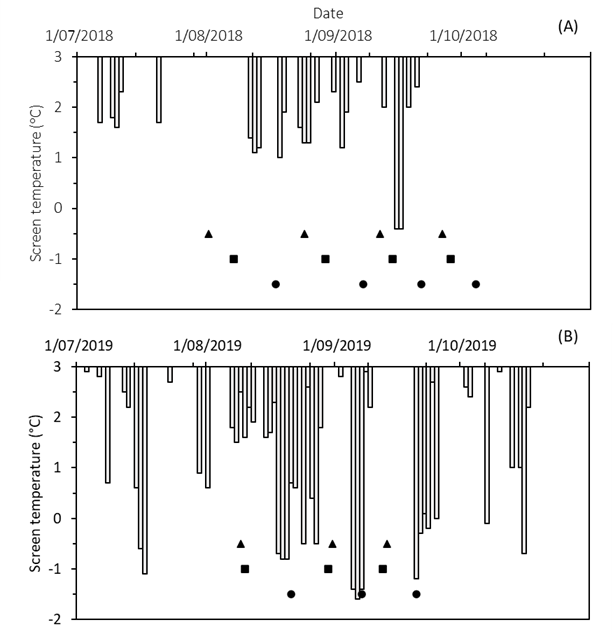
Figure 1. Screen temperature from an onsite weather station at Dale in (A) 2018 and (B) 2019. Dates in which the minimum temperature fell below 2°C (“frost” or “frost event”) are displayed. Anthesis dates (Z65) for Wyalkatchem (triangles), Scout (squares) and Cutlass (circles) are shown. The sowing dates for the corresponding anthesis dates are: 12/04/2018, 27/04/2018, 10/05/2018, 28/05/2018, 17/04/2019, 1/05/2019 and 17/05/2019.
The relationship between grain yield and floret sterility
There was a negative relationship between grain yield and floret sterility measured in the proximal florets in both seasons individually and combined (Figure 2A). There was also a negative relationship between grain yield and the floret sterility in distal florets (Figure 2B).
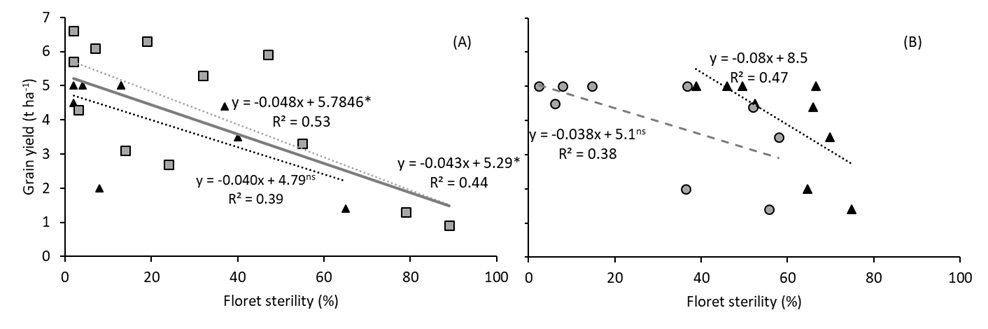
Figure 2. (A) The relationship between grain yield and floret sterility for three wheat cultivars sown on four sowing dates in 2018 (grey squares) and three sowing dates in 2019 (black triangles) at Dale, WA. The trendline for the combination of both datasets is depicted by a solid grey line. (B) The relationship between grain yield and floret sterility in proximal florets (grey circles, grey heavy-dashed trendline) and distal florets (black triangles, black light-dashed trendline) for three wheat cultivars sown on three different sowing dates in 2019 at Dale, WA.
* = significance p < 0.01, ns = not significant.
The contribution of grain position within the spikelet to spike grain yield
The contribution of grain position to total spike grain weight (and ultimately grain yield) was highest for G1 and G2 followed by G3 and then G4 (Figure 4). Contributions of each grain position varied with sowing date and floret sterility level. Changes in the contributions of each grain position within the spikelet were reflected in average grain weight and grains per spike (Figure 4).
Under low floret sterility (mid-May) (Figure 4e&f) the weight of grain in proximal positions G1 and G2 contributed more than 70% to the total spike grain weight. Wyalkatchem contributed 2–3% more yield from its proximal florets than Scout and Cutlass. The inverse was true for the distal floret positions G3 and G4 with Scout contributing 3% more grain weight from G3 and 1% more from G4 than Wyalkatchem (16.7% and 14% respectively). In Cutlass the highest relative contribution to yield came from distal florets G3 (17%) and G4 (15.4%), which was 3.4 and 2.3% greater than Wyalkatchem (respectively).
Proximal positions contributed the most to total spike grain weight under low floret sterility (Figure 4f). Differences between proximal and distal grains were significantly different (p < 0.05). The yield contributions of proximal grain positions to total spike weight did not vary between the three cultivars — ranging from 97 mg/spike for G2 in Wyalkatchem through to 126 mg/spike for G1 in Cutlass. The contributions of distal grain positions to total spike grain weight ranged from 35 mg/spike (G4 Wyalkatchem) to 62.5 mg/spike (G3 Cutlass). Significant differences were measured between Wyalkatchem and Cutlass at both G3 and G4 (Figure 4f).
Under high floret sterility (Figures 4a & b) the relative contribution of grain positions to total spike grain weight increased slightly (by 1–2.7%) at both G1 and G2 for all cultivars compared to those in the mid-May sowing, except for Wyalkatchem G2 (-1.3%) (Figure 4a). Relative yield contributions of distal florets G3 and G4 were more mixed between cultivars, with increases in one position offset by declines in the other. The yield contribution from G3 increased by 4.4% in Wyalkatchem, while G4 declined by 5.7%. In Scout, G3 declined by 4.4% while G4 increased by 2.6%. Cutlass had a 3.5% decline in yield contribution at G3 and a small 0.4% decline at G4.
In Scout and Cutlass, grain weight contributions from proximal grains in the early May sowing were 2–3 times greater than those of distal grains. In Wyalkatchem, grain weight contributions from proximal grains were 2–5 times greater than distal grains (Figure 4b). Significant differences were measured between G1 and G2 compared to G3 and G4 in Scout and Cutlass; and between G1 and G2 in Scout and Cutlass compared to G1 and G2 in Wyalkatchem. There was no significant difference between the contributions of G1 to G4 in Wyalkatchem. Grain weights in each position for mid-April were one third of mid-May values for Cutlass, half those in Scout, and one fifth of those in Wyalkatchem. Under high floret sterility, total spike grain weight in Wyalkatchem was severely reduced across G1 to G4. Greater compensation was observed in Scout than in Wyalkatchem or Cutlass with an increase in the contribution of G4 to spike weight compared to the other grain positions. In Wyalkatchem the G3 grain position in mid-April made a greater than usual (mid-May) contribution to spike weight (Figures 4a&b).
Across all sterility scenarios, the proximal grains contributed the most to spike grain weight and therefore grain yield. Focussing in-crop assessments of frost damage on these florets is therefore the most time effective and accurate way to determine frost damage at a paddock scale.
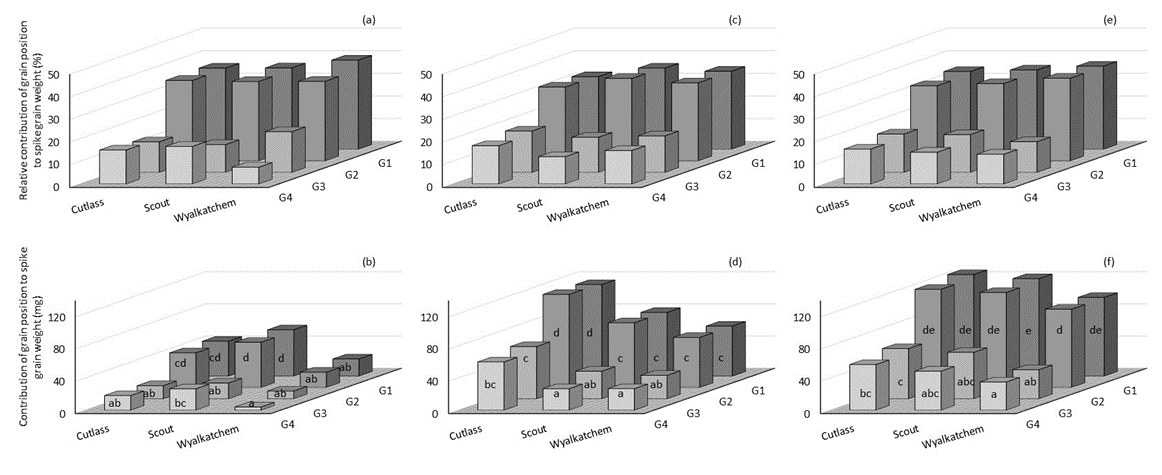
Figure 4. The relative contribution of spikelet grain position (G1 to G4) to spike grain weight in three wheat cultivars: Cutlass, Scout and Wyalkatchem, sown in mid-April (17/04/2019) (a), early May (01/05/2019) (c) and mid-May (17/05/2019) (e). Absolute spike grain weights for the same sowing dates are shown in (b), (d) and (f) with significance (p < 0.05) noted by letters with each sowing date compared separately. Relative contributions are calculated from the predicted mean of absolute spike grain weight (n=45 spikes per data column). Floret Sterility (FS) of G1 and G2 is shown at the top of each graph.
Economics of frosted crop salvage options
Hay and grain salvage options were compared and the differences between the two options compared in terms of gross income, minus the salvage option cost (Figure 5). As sowing progressed later into the season at Dale grain generally became the more profitable option and the differences in gross income between cultivars reduced. Growers need to consider if they have access to hay-making equipment, hay storage and a market for their product in addition to the costs and revenue shown below.
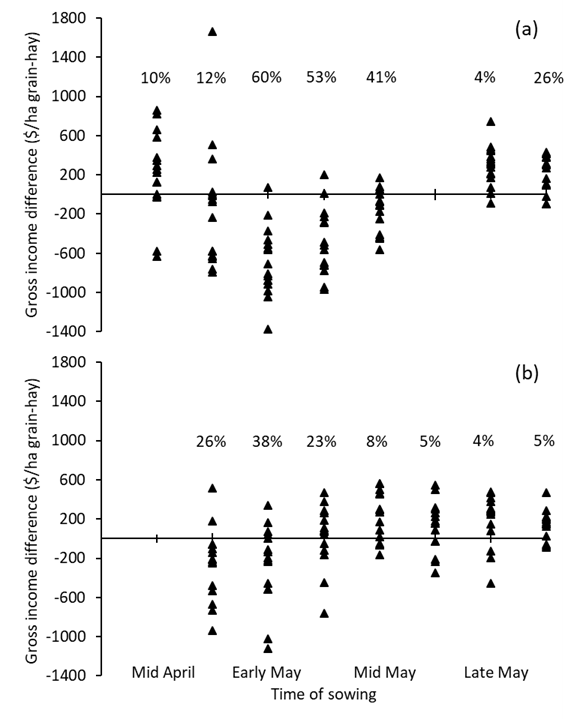
Figure 5. The economics of hay and grain salvage options for frosted crops at Dale in 2018 (a) and 2019 (b). The following were assumed: grain $300/t (it was assumed all grain met quality standards) and harvest cost $25/ha; hay $200/t, freight $155/t (15.5c/km/t), mowing $40/ha, baling $25/ha for a bale weight of 650kg. Average cultivar floret sterility percentages for each sowing date are shown above each corresponding set of data.
Conclusion
Growers should continue to monitor crops for frost damage, particularly when their local weather station records screen temperature below 2°C. The extent of damage can be determined by assessing 1) the number of sterile/damaged anthers and/or ovules within the outermost florets of the spike to calculate a percentage of sterile florets and 2) the number of spikes that have symptoms of frost damage from a transect of frost-prone parts of the landscape. The recovery of crops damaged by frost events varies with the amount of soil water available to plants, the potential for spring rains and the amount of growing season left. Compensation via new tillers is possible if frosts occur early in August and average or above average rain occurs in spring or if crops have access to sufficient stored soil moisture. However, late frosts in September and early October with below average rainfall often result in either no new tillers or tillers than do not go on to form grain. The likelihood of tiller compensation following frost should be carefully considered in any post-frost management decisions. Increasing grain size within the spike is a possibility, but it is a less likely event, and the underlying physiological mechanism are poorly understood and require further investigation.
References
Acreche, M.M., Slafer, G.A., 2006. Grain weight response to increases in number of grains in wheat in a Mediterranean area. Field Crops Research 98, 52-59.
Biddulph, B., Laws, M., Eckermann, P., Leske, B., March, T., Eglinton, J., 2015. Preliminary ratings of wheat varieties for susceptibility to reproductive frost damage. Crop Updates. Grain Industry of Western Australia, Perth.
Bremner, P., Rawson, H., 1978. The weights of individual grains of the wheat ear in relation to their growth potential, the supply of assimilate and interaction between grains. Functional Plant Biology 5, 61-72.
Cocks, N.A., March, T.J., Biddulph, T.B., Smith, A.B., Cullis, B.R., 2019. The provision of grower and breeder information on the frost susceptibility of wheat in Australia. The Journal of Agricultural Science 157, 382-398.
Ferrante, A., Zerner, M., Leske, B., Biddulph, B., March, T., 2017. Differences in yield physiology in wheat cultivars grown under frost-prone field conditions in Southern Australia. In the Proceedings of the 18th Australian Society of Agronomy Conference, Ballarat, Victoria, 24-28 September 2017.
GRDC National Frost Initiative, 2019. FV-PLUS Frost Rankings https://nvt.grdc.com.au/grdc-nfi-frost-rankings
Leske, B., Biddulph, B., D'Antuono, M., Onyemaobi, I., Colmer, T., 2019. Sample size is critical when exploring the grain set in wheat cultivars grown under frost-prone field conditions in Western Australia. In the Proceedings of the 19th Australian Society of Agronomy Conference, Wagga Wagga, New South Wales, 25-29 August 2019.
Smith R., Minkey, P., Butcher, T., Hyde, S., Jackson, S., Reeves, K., Biddulph, B., (2017). Stubble management recommendations and limitations for frost prone landscapes, in 2017 GRDC Crop Updates, Perth, Western Australia.
Zadoks, J.C., Chang, T.T., Konzak, C.F., 1974. A decimal code for the growth stages of cereals. Weed Research 14, 415-421.
Zheng, B., Biddulph, B., Li, D., Kuchel, H., Chapman, S., 2013. Quantification of the effects of VRN1 and Ppd-D1 to predict spring wheat (Triticum aestivum) heading time across diverse environments. Journal of Experimental Botany 64, 3747-3761.
Acknowledgments
The research undertaken as part of this project is made possible by DPIRD, GRDC and UWA funding. The significant contributions of growers through both trial cooperation (Bill, Anne Cleland and families, Dale WA) and the support of the GRDC, the author would like to thank them for their continued support. We thank Living Farm for trial implementation and maintenance, Nathan Height and Ghazwan Al Yaseri for technical assistance.
Paper reviewed by: Amanuel Bekuma and Glenn McDonald, DPIRD
Contact details
Brenton Leske
DPIRD
3 Baron-Hay Court South Perth, WA
Ph: 08 9368 3161
Email: brenton.leske@dpird.wa.gov.au
GRDC Project Code: UWA1707-007RSX,
Was this page helpful?
YOUR FEEDBACK