Making N applications pay this season – efficiencies of fertiliser usage.
Author: Wayne Pluske (EQUII) | Date: 29 Jun 2022
Take home messages
- To make nitrogen (N) pay it is important to scrutinise returns on N rates because rate has most impact on fertiliser profitability.
- Assumptions about past profitability of N are often wrong.
- Robust analysis of N rate profitability requires N response curves. Fertiliser response curves illuminate past N profitability and can be used to improve future N rate decisions.
- N could stay expensive for years. Now is the time to start a more objective approach to N rate decisions by measuring and analysing N rate profitability.
Background
Nitrogen (N) applications can be a gamble at the best of times, let alone when the cost of N skyrockets. Current high prices have fertiliser expenditure under the microscope and while there is a lot of commentary around tightening margins and cutting N rates, there is little focus on the core issue of N profitability. This lack of focus on profit happens even when N is cheaper, when we somehow assume the N rates we are applying are profitable. Current high N costs could be the jolt we need to take a closer look at how profitable N really is, regardless of its cost.
It is common to cut N rates when fertiliser is expensive to make budgets work. It’s also common to ignore or guess - rather than measure - how much yields change as a consequence of the reduced rate. Unless we specifically measure yield responses to N rates, we won’t know how profitable N is. If we only consider the overall profit of the crop, factors like seasonal conditions and grain prices can hide suboptimal N decisions. A profitable cropping operation does not necessarily mean profitable investment in N.
As fertilisers are always a large variable input cost, there is much to gain from continually assessing their profitability. Better fertiliser use has more potential to improve profitability than other variable costs because fertiliser rate can be tweaked. For growers already optimising their fertiliser types, placement and timing, better rate decisions are their biggest opportunity.
There are many tools such as soil tests, N budgets and other models to predict rates, and N use efficiency (NUE) is a handy retrospective measure of how useful N was, but what is missing is a detailed and financially-focussed method to determine the most cost-effective N rates.
Fertiliser responsiveness
Measuring and analysing fertiliser N responsiveness considers return on investment (ROI) and:
- helps determine profitable rates even when fertiliser, grain prices and seasons fluctuate
- questions long held assumptions that we are using cost-effective rates
- starts to quantify risks of investing in fertiliser, giving us confidence to change rates.
Despite many advisers and growers believing they do not recommend or invest in N unless the investment is doubled ($1 invested leads to $2 revenue), ROI on N is rarely measured. Sometimes ROI is roughly gauged by comparing yields from the ‘base’ paddock N rate to a higher N rate strip within the paddock. No difference between the strips means the paddock rate is too high, but by how much? If the N-rich strip yields more than the base rate, the paddock rate could be insufficient. But again, we don’t know by how much. We cannot determine the economic optimal N rate, which may lie somewhere between the paddock rate and higher rate, and we certainly don’t know the rate of return on either the paddock rate or the N-rich rate. Zero N strips have the same aim as N-rich strips but tend to be used where over-fertilising is more of a concern than under-fertilising.
When a crop is responsive to fertiliser, there are diminishing marginal returns on fertiliser as rate increases - the first dollar gives the biggest ROI then ROI gradually diminishes until there is not enough justification to invest more. But when a basic net return analysis is used (for example, to assess a N-rich strip) of:
Net Return of Rate 2 = (Revenue Rate 2 – N Cost Rate 2) – (Revenue Rate 1 – N Cost Rate 1)
higher ROI on lower individual N rates compensates for poorer ROI on higher N rates, making the total investment in all N rates between Rate 1 and Rate 2 appear better than it really is.
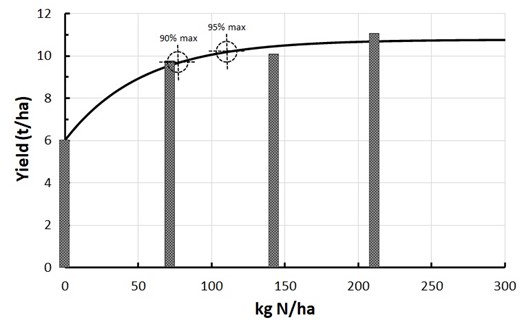
Measuring N profitability properly means focussing on how cost-effective each marginal unit of 1kg N/ha is. This requires yield response data for each incremental unit of N which comes from an N response curve, generated from at least four N rates including a nil rate (Figure 1). If only two rates are used, the N response is a line and three N rates are not enough to determine the response curve shape.
In Figure 1, 90 and 95% of maximum yield are achieved with 78 and 115kg N/ha respectively. In this case, yield continues to increase above 200kg N/ha, albeit in very small increments. In many situations higher rates actually have an adverse effect on yield.

Figure 1. Fertiliser N response curve, derived from four rates.
Absolute yields are irrelevant, yield changes matter
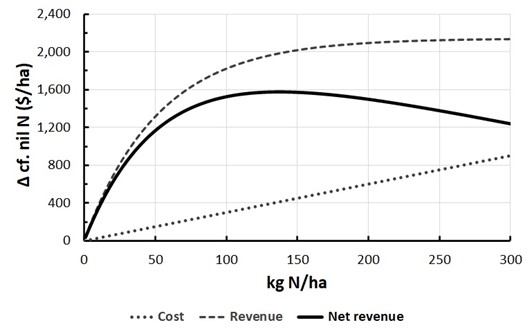
When focussing on N profitability, only the yield change caused by each incremental unit of N is important. The absolute yield, while paramount for overall grain profitability, is not relevant for the profitability of the single variable input cost of N. See Figure 2, which shows the finances of Figure 1, using an N cost of $3/kg N and grain price of $450/t. Net revenue (that is, revenue minus cost) peaks with 137kg N/ha, considerably higher than the 115kg N required to achieve 95% of maximum yield (Figure 1). At rates above 137kg N/ha, the increases in revenue are less than the cost of N, so net revenue declines.

Figure 2. Financial measures of the N response in Figure 1.
The problem with the financial analysis in Figure 2 is that it does not identify the best N rate because it does not include ROI. ROI is calculated by dividing the profit (or net revenue) earned on an investment by the cost of that investment:
ROI (%) = Profit / Cost x 100
The calculation works well with “all or nothing investments” like fuel, tyres and tractors, but care needs to be taken when adopting it to a rate dependent investment like N. For instance, at the profit maximising rate of 137kg N/ha in Figure 2:
Revenue = $1,986/ha
Cost = $411/ha
so Profit = $1,986 - $411 = $1,575/ha
and ROI (%) = ($1,575 / $411) x 100 = 383%
This method of calculating ROI has the same issue as the first calculation (net return). By averaging the ROI of each N unit, it ignores diminishing returns, and the higher ROI on the lower N rates (for example, the first 1kg N/ha has an ROI of 1,245%) compensates for the lower ROI on the higher units (for example, ROI on the 137th unit is less than 2%).
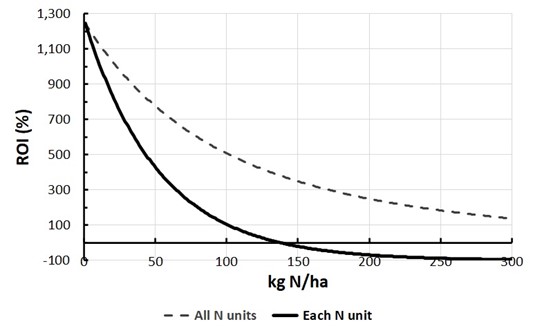
A serious fertiliser investment analysis uses a fertiliser response curve to calculate the ROI on every incremental unit of fertiliser to determine which units deliver acceptable returns, which ones don’t and where to stop applying fertiliser. Figure 3 does this, building upon the data in Figure 2, and compares the ROI on all N units (calculated using the method described above) with the ROI on each marginal unit of N.

Figure 3. ROI on all fertiliser N units (up to an including the kg N/ha rate) and on each marginal fertiliser N unit.
ROI using all N units tells us even 300kg N/ha delivers more than 100% ROI. Looking at each kg of N individually, an ROI of at least 100%, which is what most advisers and growers are after, is achieved up to the 101st unit of N. Breakeven or money back happens with the 138th unit and all units above that are costing the grower money.
To summarise the calculation outputs:
- 90 and 95% of maximum yield are achieved with 78 and 115kg N/ha
- Net revenue analysis calculates profit is maximised with 137kg N/ha
- ROI based on all N units calculates 137kg N/ha has a ROI of 383%
- A target of 100% ROI on each N unit is achieved with 101kg N/ha. N rates above this deliver ROI less than the target.
Considering carbon
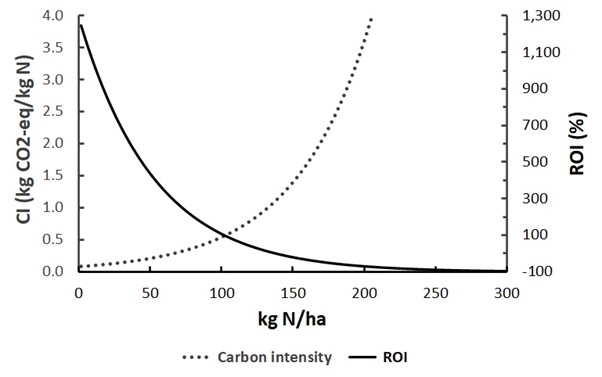
This methodology to assess each N unit can also be used to calculate the carbon footprint of fertiliser when producing grain. Continuing the example above, the carbon intensity of each unit of N is shown in Figure 4, along with the ROI on each unit of N from Figure 3. It is very clear when N becomes too expensive to justify applying more, it also becomes very costly for the environment.

Figure 4. Carbon intensity (CI) and ROI on each unit of fertiliser N.
Conclusion
Rough calculations to assess N profitability can be misleading. To truly understand N profitability, we need to calculate the ROI of each incremental/marginal kg of N. This is done using yield data from at least four N rate treatments and generating a fertiliser response curve.
Sound N response and profitability analysis is a flexible and fluid process that takes account of N and grain prices, and different magnitudes and shapes of N yield responses. It provides quantitative financial information to assess returns and risks to arrive at more considered and profitable N rates.
Useful resources
GroundCover article - Fertiliser profitability by Alisa Bryce and Wayne Pluske.
Contact details
Wayne Pluske
0418 726 121
wayne@equii.com.au
Was this page helpful?
YOUR FEEDBACK
