Yield response to plant density in faba beans: management and profitability implications
Author: James Manson (University of Adelaide), Victor Sadras (South Australian Research and Development Institute), Jason Brand (Agriculture Victoria) | Date: 27 Jul 2022
Take home messages
- Analysis of data from 76 Australian experiments showed that faba bean grain yield was maximised by a plant density from 13 plants/m2 in high yield environments, through to 57 plants/m2 in low yield environments.
- Faba bean grain yield is highly responsive to plant densities from 10 to 30 plants/m2 so the sowing rate should be regarded as an important management tool.
- Yield constraints such as weeds, diseases and frost changed the plant density required to maximise grain yield.
- To increase grain yield in the presence of constraints, growers can: 1) increase plant density, 2) ameliorate other constraints to improve the yield at lower plant densities, or 3) find compromises between 1) and 2).
- For all environments measured, an increase from 20 to 25 plants/m2 (130 to 160 kg seed/ha) increased profitability with a range of -$22/ha to +$254/ha depending on grain price and yield.
- Increasing plant density may lead to a requirement for additional protective fungicide applications and windrowing of tall crops, but the need for these measures will depend on the season.
Background
Three components determine the grain yield of a crop:
- how long the crop grows for
- how quickly it grows
- how much of the accumulated resources ends up in the grain.
Growers can manipulate these components through various agronomic levers, for example, ameliorating soil constraints or varying the sowing date, variety (maturity type) or plant density. Here we will focus on plant density because it has a significant impact on faba bean grain yield. Increasing plant density could increase crop growth, at least during the early part of the season. However, this can potentially cause a greater depletion of soil moisture, leading to earlier maturity. Individual plant size decreases with increasing plant density which can affect how much growth is allocated to the grain. The net effect of these changes is addressed in this paper.
Increasing plant density causes earlier canopy closure that increases competitive ability with weeds but also favours Ascochyta blight and chocolate spot, and taller crops with higher risk of lodging. Therefore, changes in plant density have multiple effects and involve trade-offs with implications for profitability and risk.
Industry guidelines usually recommend 15–25 plants/m2 produce optimal yields but individual experimental results are inconsistent. Here we compile a large data set and synthesise the results to clarify the interaction of plant density with the environment, using yield as a proxy for environmental conditions.
Method
We retrieved plant density and grain yield data for each unique combination of variety, row spacing and sowing date from 76 experiments conducted across the Australian grain belt from 1982 to 2021, which totalled 123 density-yield datasets.
Asymptotic curves (a curve that rises rapidly to approach a maximum and then plateaus) were fitted to each experiment. The median R2 for these curves was 0.95 indicating that the mathematical model fit the data extremely well. From the curves, we calculated the plant density required to reach 95% of peak yield, and the yield at 10, 15, 20, 25 and 30 plants/m2.
In the discussion below, we outline the steps taken to estimate the effect of plant density on profitability.
Results and discussion
Plant density to maximise grain yield decreases in high yielding environments
Figure 1 shows that the plant density required to achieve 95% of the maximum grain yield was at least 30 plants/m2 in low-yield environments (1 t/ha or less), decreased to approximately 20 plants/m2 in medium-yield environments (3 t/ha), and to approximately 15 plants/m2 in high-yield experiments (5 t/ha or greater). There was no relationship between growing season rainfall and the yield-maximising plant density. This means that favourable conditions, incorporating multiple factors and not just rainfall, allow low density stands to fully capture resources (water, radiation, nutrients) and maximise yield. On the other hand, more plants are required to compensate for adverse conditions.
In 90% of the experiments, at least 19 plants/m2 were required to maximise grain yield. This plant density would require 130 kg/ha of seed if the seed size was 65 g per 100 seeds. Growers who are near or below this sowing rate should be aware that plant numbers may be limiting their grain yield, especially in lower yielding sites and seasons. It should be noted that maximising profit may require a different plant density to that which maximises grain yield, and this is discussed below.
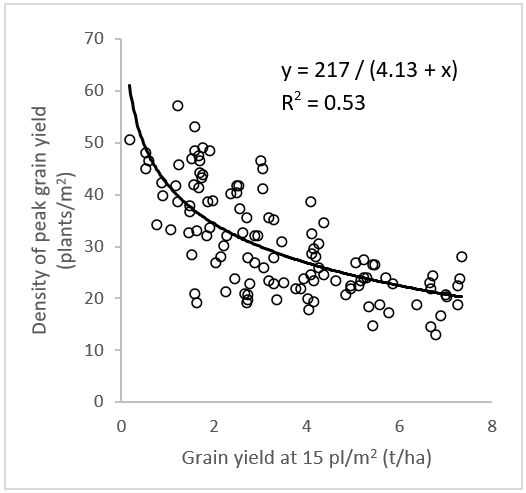
Figure 1. The plant density required to achieve 95% of maximum grain yield as a function of grain yield at 15 plants/m2. The data is calculated from 123 plant density response curves retrieved from 76 experiments conducted in Australia between 1982 and 2021.
Growers can accommodate plant density to growing conditions
We explored the variation between the points in Figure 1 to understand how plant density interacts with other yield-limiting factors.
Figure 2a shows that irrigated crops generally required a lower plant density to maximise grain yield. Irrigation is not an option available to dryland growers, but the comparison indicates that moisture supply shifts the density-yield relationship. Data on soil type and moisture could inform adjustments to plant densities between paddocks or zones of paddocks.
Figure 2b indicates that higher plant densities are higher yielding in the presence of weeds. The history of a paddock and the expected weed pressure could be factored into decisions about plant density with the understanding that a higher plant density could favour both crop competition with weeds and grain yield.
Figure 2c highlights three datapoints of severely frosted crops in northern New South Wales in 2015. These crops reached 95% of the maximum grain yield at around 20 plants/m2, whereas 25–30 plants/m2 were required in other trials with environments of a similar yield. This indicates that some stresses, such as severe frosts, can override potential effects of plant density. Increasing plant density to maximise grain yield may not be appropriate in frost-prone areas, or frost could be avoided with a later sowing but compensated for with a higher plant density.
These findings indicate that growers have three ways to accommodate plant density to constraints: 1) increase the sowing rate, 2) address other yield constraints to improve the performance of lower plant densities, or 3) find compromises between options 1) and 2) on a paddock-by-paddock basis.
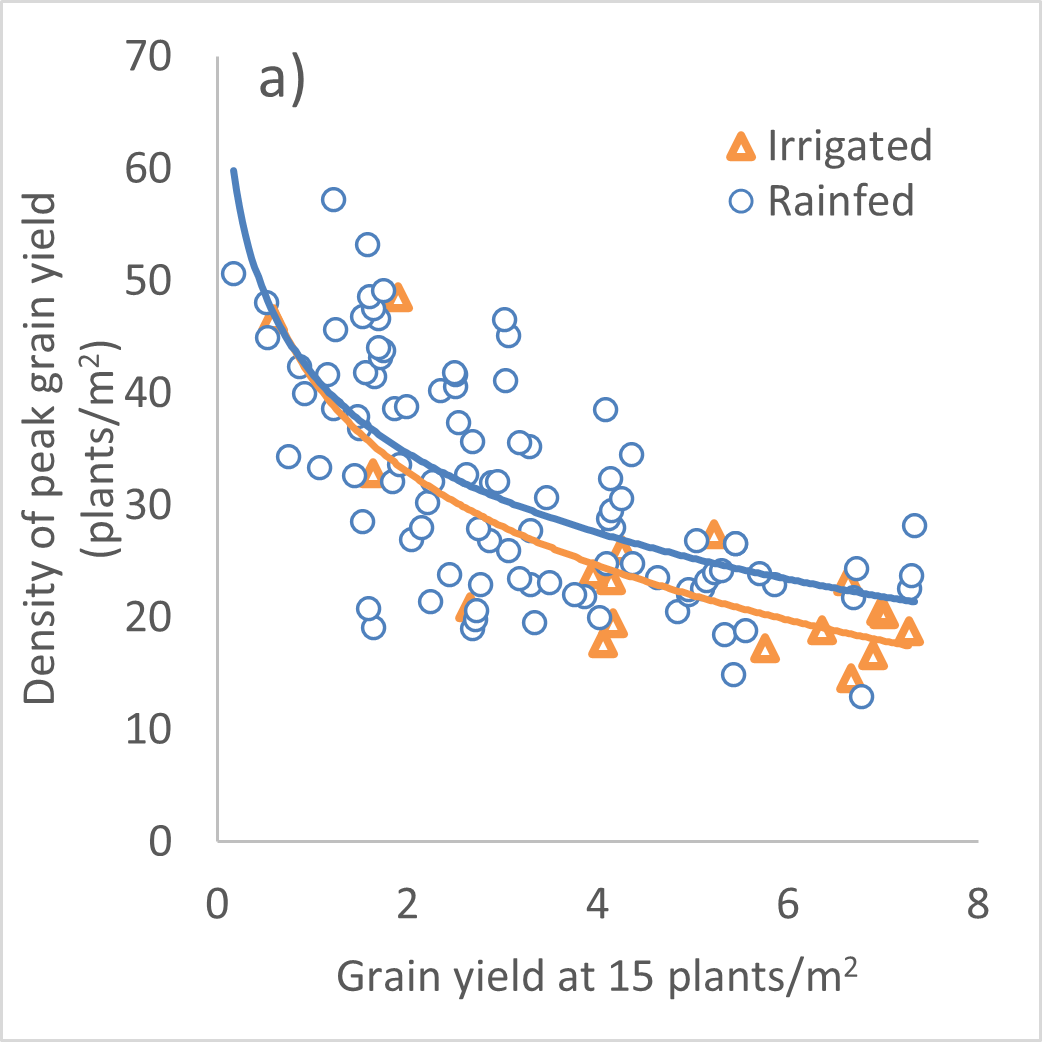
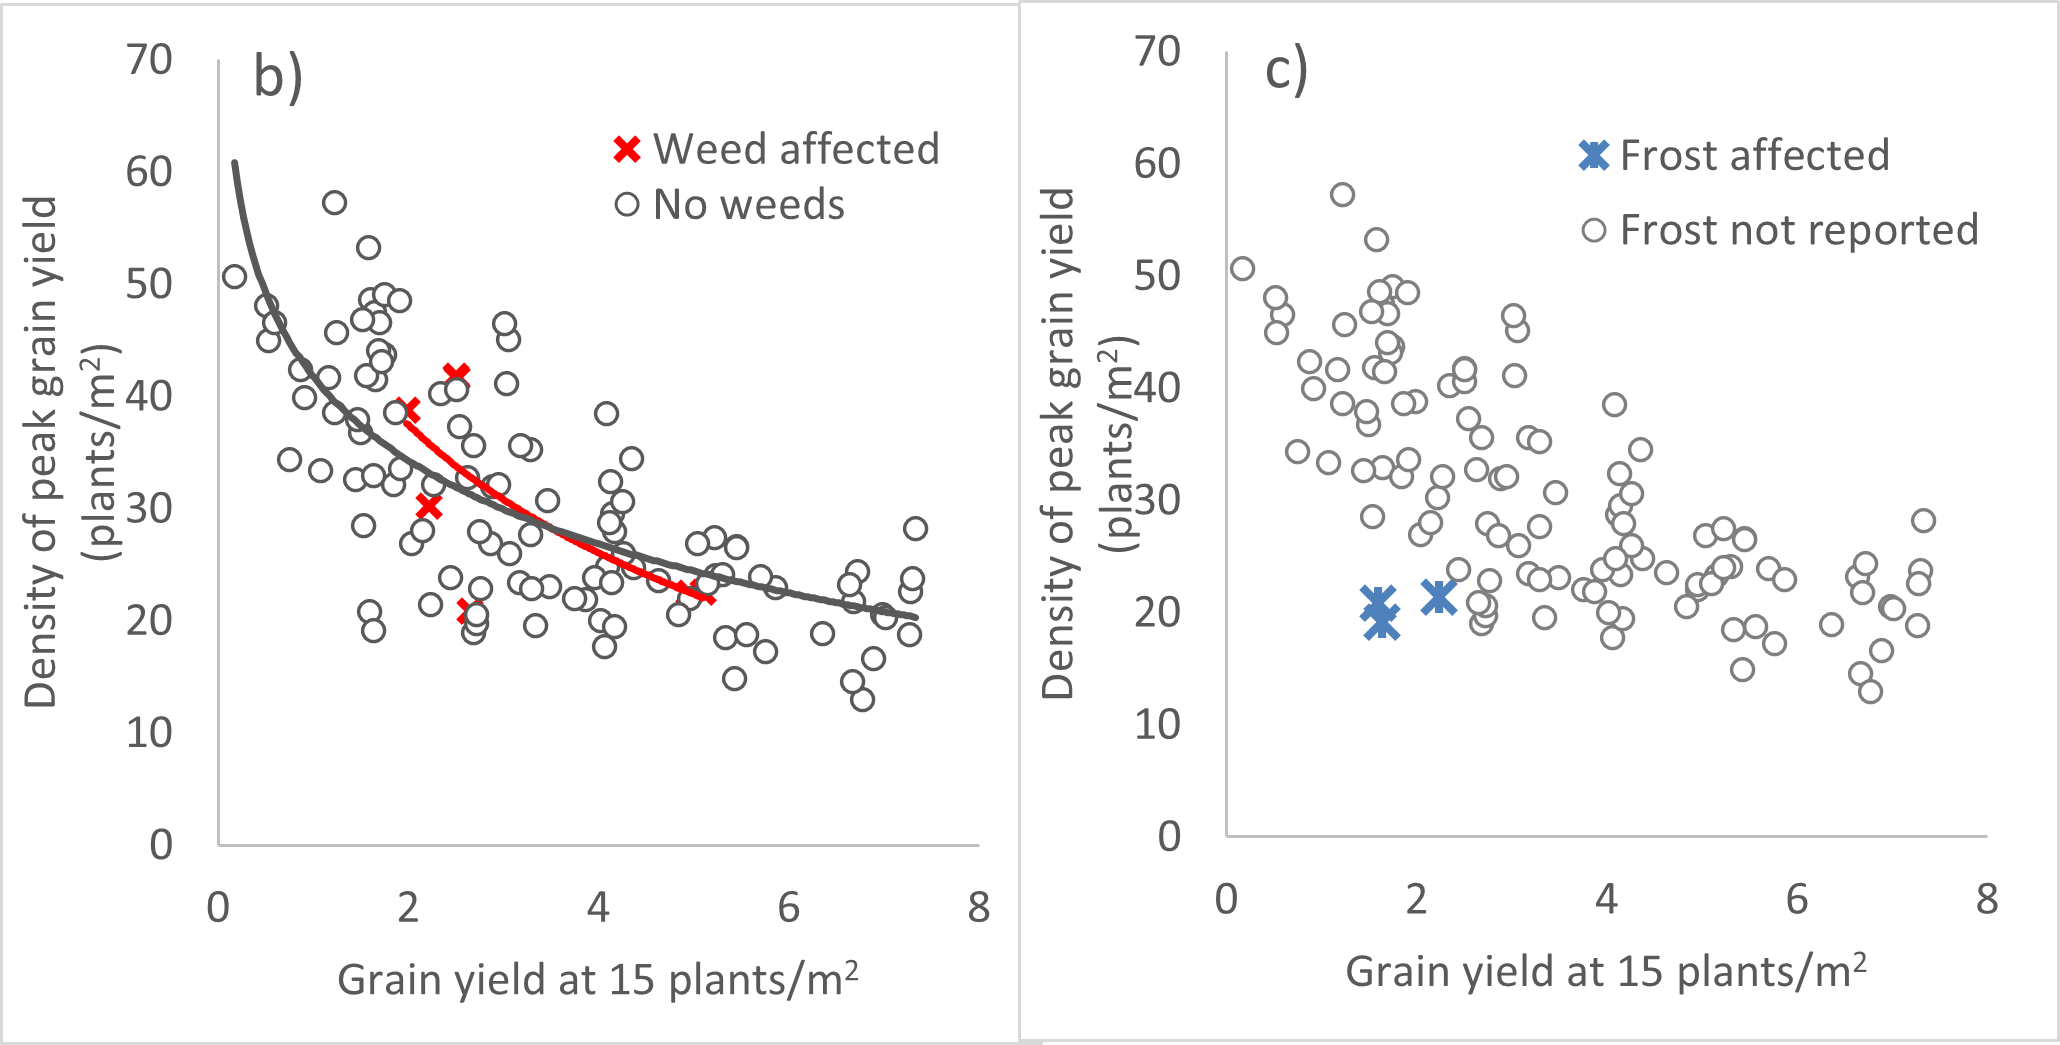
Figure 2. The plant density required to achieve 95% of maximum grain yield as a function of grain yield at 15 plants/m2 in experiments a) with or without irrigation, b) with or without weeds reported, and c) with or without frost reported.
Plant density, biomass and lodging
Figure 3 shows grain yield increased with total biomass at maturity, which was in turn related to plant density in a low-yield environment of Western Australia (1.7 t/ha at 15 plants/m2) and a higher yielding environment in Victoria (5.4 t/ha at 15 plants/m2). There was no lodging in the low-yield environment, and moderate lodging occurred in all treatments of the high-yield environment. This illustrates how the relationships between plant density, biomass and the risk of lodging are highly dependent on the growing environment.
Comparing the data points to the 60% harvest index line in Figure 3 shows that the relationship between yield and biomass levelled off with total biomass >12 t DM/ha, that is, they were ‘decoupled’ in high-yielding environments. High biomass with relatively less grain may return more nitrogen to soil fertility and compensate for this loss of production efficiency.
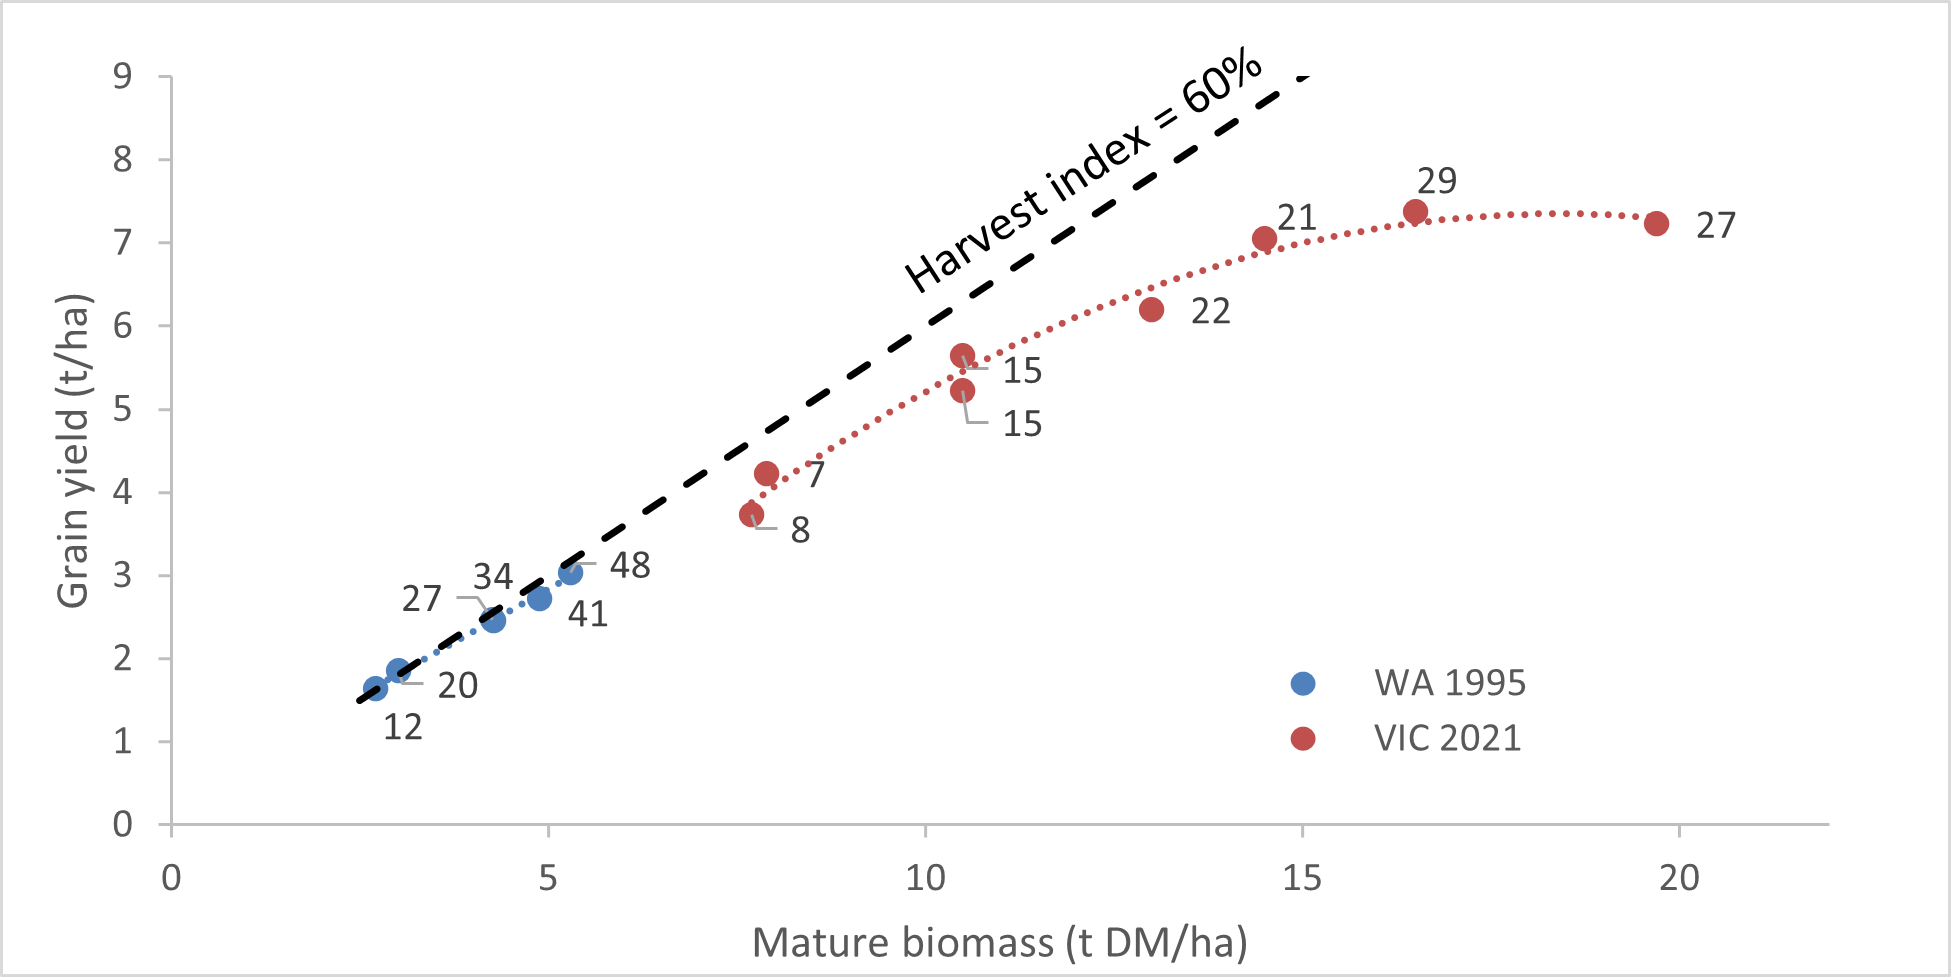
Figure 3. The relationship between grain yield and total above ground biomass at maturity in two experiments with plant density treatments. The data are labelled with the established plant density (plants/m2) and the dashed line represents a harvest index (the ratio of grain biomass to total mature biomass) of 60%.
Plant density and disease management
Crops with visual symptoms of disease generally required higher plant densities to maximise grain yield than asymptomatic crops (Figure 4). This is despite the higher disease severity that occurred in these treatments (data not presented).
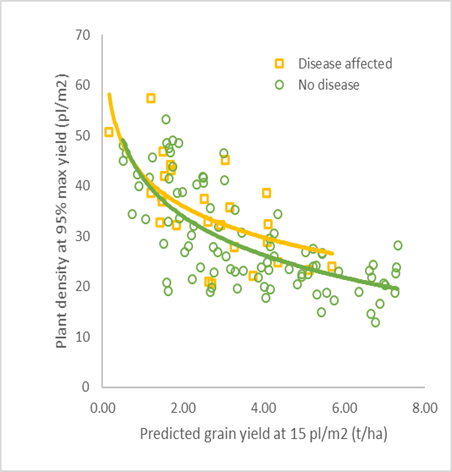
Figure 4. The plant density required to achieve 95% of maximum grain yield as a function of grain yield potential (defined as the grain yield achieved by 15 plants/m2 in the experiment), in experiments that were disease affected or had no disease.
Figure 5 shows three experiments contrasting in the onset and final severity of chocolate spot disease. Despite the use of fungicides, chocolate spot infected all treatments due to the ability of the disease to spread from an unsprayed plot to a sprayed plot. In each experiment, chocolate spot caused substantial yield losses, so prevention of disease onset should be the first priority for disease management.
With no fungicides (open symbols in Figure 5), a variety with disease rating MRMS to chocolate spot (PBA Amberley) outyielded a variety rated S (PBA Bendoc). However, when fungicides were applied (closed symbols in Figure 5), the two varieties were similar in the less severe experiments (Figures 5a and 5b, compare with Figure 5c).
Therefore, assuming growers intend to use fungicides, the value of a higher disease resistance rating may reside more in preventing disease with fungicides than in tolerating an established disease. Interestingly, there are no treatments where 20 plants/m2 yielded less than 10 plants/m2, even though the disease infection was more severe.
In these experiments, the weather was the primary factor driving the onset of disease, which occurred at approximately the same time in both plant density treatments. Therefore, these results do not account for the possibility that a higher plant density could lead to an earlier infection in some seasons compared to a lower plant density, or that fungicide control may be more effective with lower plant density stands.
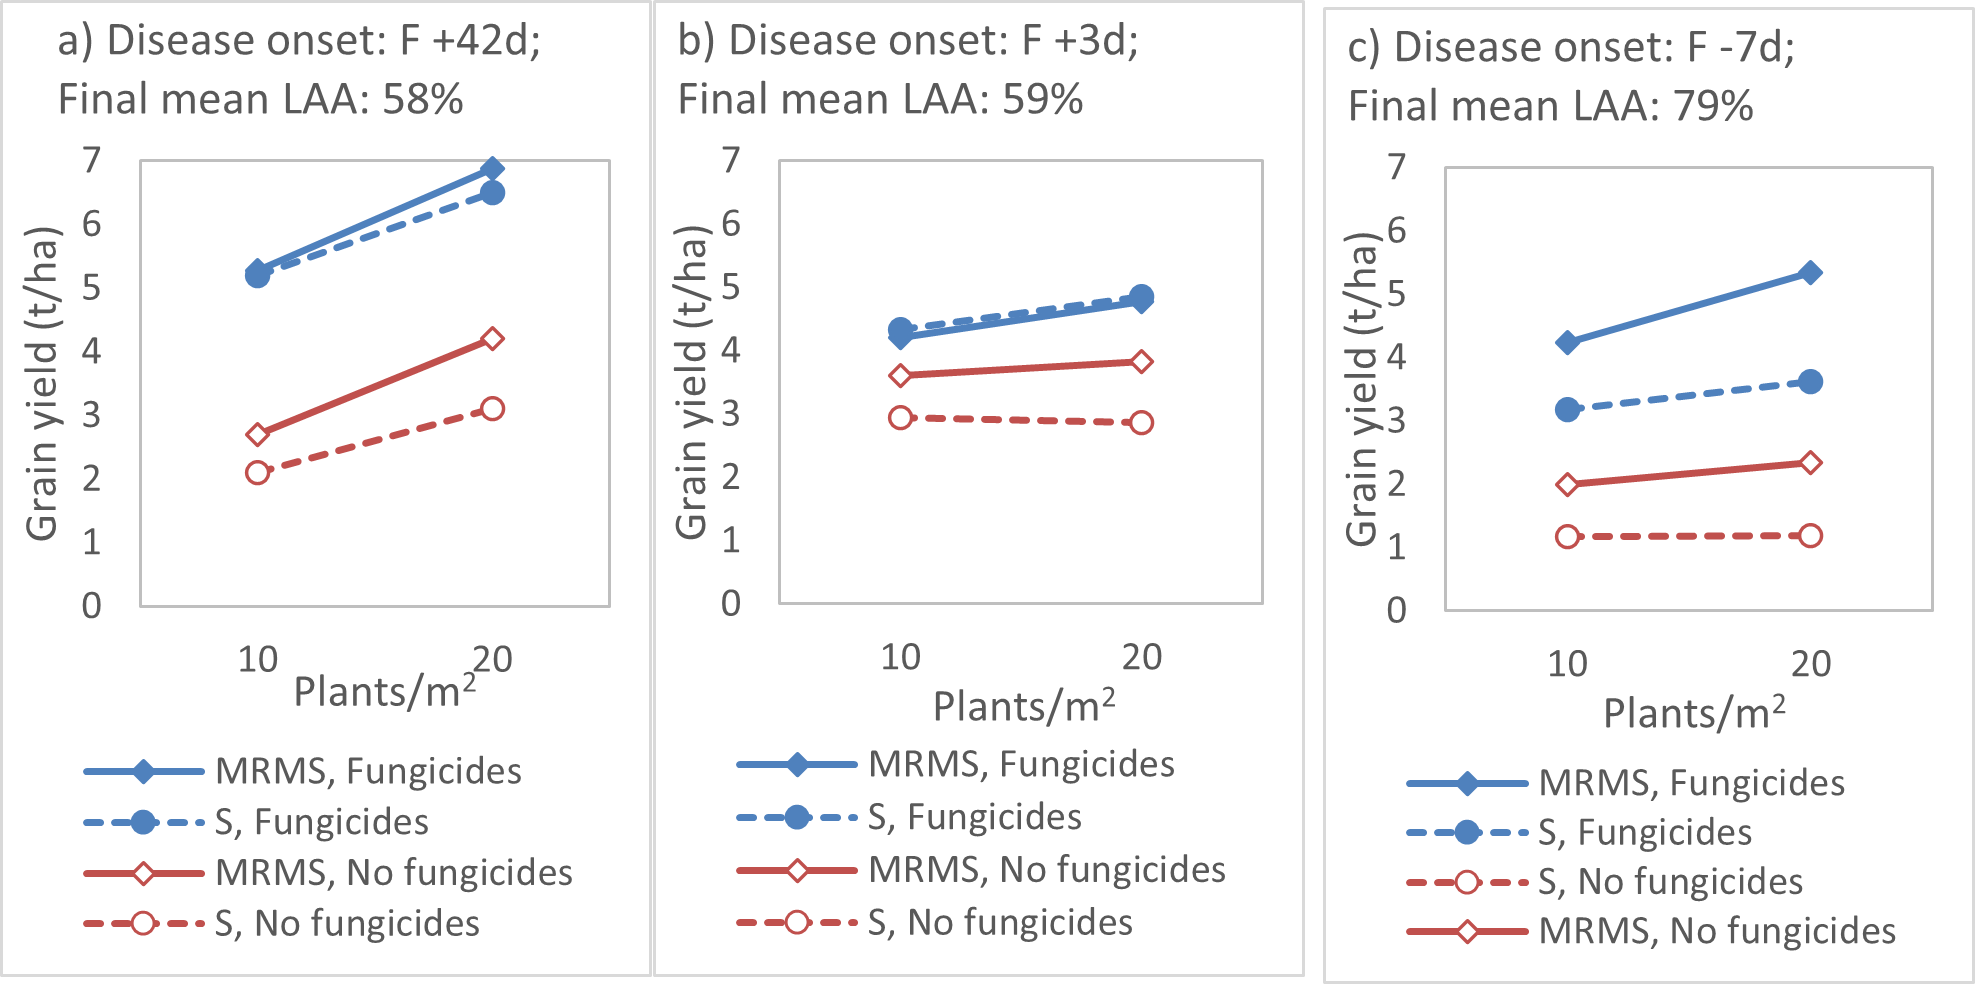
Figure 5. The effects of plantdensity, cultivar disease rating to chocolate spot (MRMS “Moderately Resistant Moderately Susceptible”, PBA Amberley, or S “Susceptible”, PBA Bendoc
) and the use of fungicides on faba bean grain yield in three experiments contrasting in the onset of disease (Flowering “F” + number of days) and the mean final severity of disease (LAA “Leaf area affected”). a) Vite Vite North, VIC, 2021, b) Lake Bolac, VIC, 2020, c) Tarrington, VIC, 2020.
Sowing rate and profitability
Here we outline a method to predict the effect of plant density on profitability. Growers can follow the process and adjust the values for their own businesses.
Predicted yield changes from the plant density-yield response curves
The plant density-yield response curves were used to predict the change in yield associated with an increase or decrease in plant density around 20 plants/m2 (Figure 6). Then, the average effect was predicted from the slope of the trendline for each plant density (boxes in Figure 6).
The differences in grain yield between plant densities increased proportionally as yield increased. The yield losses from decreasing plant density below 20 plants/m2 were greater than the yield increases above this threshold.
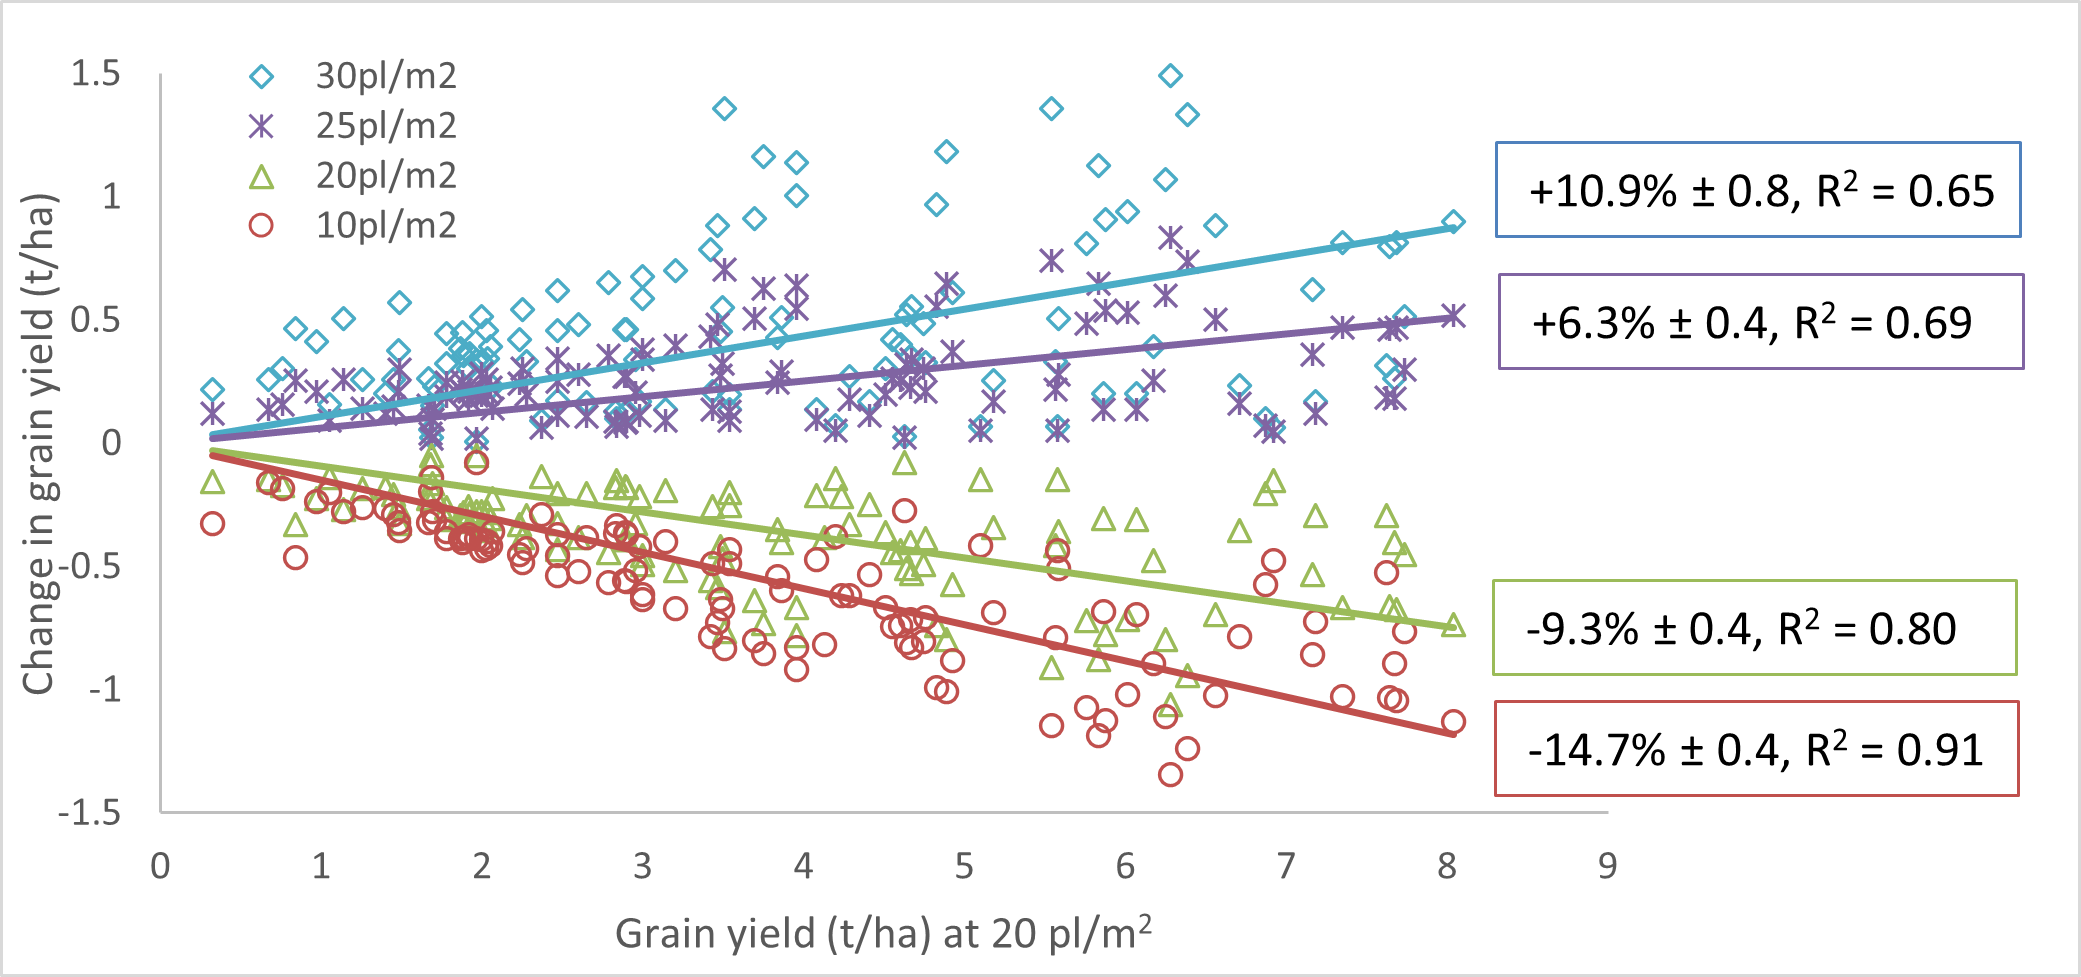
Figure 6. The change in grain yield relative to plant density compared with grain yield at 20 plants/m2. The slope of each line is presented as a percent of the grain yield at 20 plants/m2, ± the standard error.
Predicted changes to profitability
Change in costs
The change in sowing rate to achieve a given plant density is a function of the seed size. For example, for a seed size of 65 g per 100 seeds, every increase of 5 plants/m2 requires an increase in sowing rate of 32.5 kg/ha. The capacity of the seeder may limit the maximum sowing rate that can be achieved.
The model for predicting the change in costs accounted for the effect of plant density on sowing and harvest operation costs, the number of fungicide inputs and the cost of sowing seed. It accounted for the effect of grain yield on freight cost and end point royalties. The costs were estimated from recent PIRSA Gross Margin and Enterprise Planning Guides, and the predicted changes were based on discussions with agronomists. See Table 1 for a summary.
Table 1: Estimated changes in costs associated with changing the sowing rate.
Cause of change | Variable cost | Estimated cost | Predicted change |
|---|---|---|---|
Plant density | Sowing seed | $0.60/kg | +$19.5 per 5 plants/m2 |
Sowing operational costs (labour and machinery) | $50/ha | +10% per 5 plants/m2 | |
Fungicide applications | $20/application | 0.5 applications per 5 plants/m2 | |
Harvest operational costs (labour and machinery) | $100/ha | +10% per 5 plants/m2 | |
Grain yield | Freight cost | $25/t harvested grain | Function of change in yield |
End point royalties | $4/t harvested grain | Function of change in yield |
Change in income
The trendlines in Figure 6 were used to create an index of predicted grain yields for each plant density from 5 to 25 plants/m2, this is available in the Appendix, Table A1.
The change in income is the product of the change in yield and the grain price. The median grain price for faba beans at Adelaide is $350/t. Partial budgets were calculated with grain prices of $200, $300, $400 and $500 per tonne of harvested grain to test price sensitivity.
Effect on profitability
The effect of plant density on profitability was calculated for yield from 1 to 6t/ha. See the appendix for the equation. The results were divided into low (1–3t/ha), medium (2–4t/ha), high (3–5t/ha) and very high (4–6t/ha) yield, at the three grain prices described above. See Table 2.
The only situation in which it was profitable to reduce plant density below 20 plants/m2 was for low yields and the very low grain price of $200/t. When grain price was $300/t or higher, it was more profitable to increase the sowing rate above 20 plants/m2. The change in profit for an increase from 20 to 25 plants/m2 (130 to 160kg/ha) was -$22/ha to $254/ha, depending on grain price and yield.
Some variability is masked by making these estimations with the average yield response to plant density (the slopes in Figure 6).
Table 2: The effect of changing the plant density above or below 20 plants (pl)/m2 on profitability ($/ha) as a function of grain price, yield and extra costs. The cell shading indicates negative, neutral or positive effects on profitability.
Grain price | 10 pl/m2 (70kg/ha) | 15 pl/m2 (100kg/ha) | Yield range at 20 pl/m2 (130kg/ha) | 25 pl/m2 (160kg/ha) | 30 pl/m2 (190kg/ha) |
|---|---|---|---|---|---|
$200/t | 42 to -8 | 19 to -13 | 1-3t/ha | -22 to 0 | -45 to -8 |
17 to -33 | 3 to -28 | 2-4t/ha | -11 to 10 | -27 to 11 | |
-8 to -59 | -13 to -44 | 3-5t/ha | 0 to 21 | -8 to 29 | |
-33 to -84 | -28 to -60 | 4-6t/ha | 10 to 32 | 11 to 48 | |
$300/t | 22 to -43 | 7 to -34 | 1-3t/ha | -13 to 15 | -25 to 34 |
-10 to -75 | -14 to -55 | 2-4t/ha | 1 to 28 | 5 to 64 | |
-43 to -108 | -34 to -76 | 3-5t/ha | 15 to 42 | 34 to 93 | |
-75 to -140 | -55 to -96 | 4-6t/ha | 28 to 56 | 64 to 123 | |
$400/t | 0 to -109 | -7 to -76 | 1-3t/ha | -4 to 43 | -14 to 67 |
-55 to -164 | -42 to -111 | 2-4t/ha | 19 to 66 | 26 to 107 | |
-109 to -218 | -76 to -145 | 3-5t/ha | 43 to 90 | 67 to 148 | |
-164 to -273 | -111 to -180 | 4-6t/ha | 66 to 113 | 107 to 188 | |
$500/t | -15 to -153 | -17 to -104 | 1-3t/ha | 2 to 62 | -3 to 100 |
-84 to -222 | -60 to -148 | 2-4t/ha | 32 to 91 | 48 to 151 | |
-153 to -292 | -104 to -192 | 3-5t/ha | 62 to 121 | 100 to 202 | |
-222 to -361 | -148 to -236 | 4-6t/ha | 91 to 151 | 151 to 254 |
Conclusion
In 76 Australian experiments, where yield ranged from 0.2 to 7.3t/ha, the plant density that maximised grain yield ranged from 13 plants/m2 in a high yield environment through to 57 plants/m2 in a low yield environment. In most cases, grain yield and profitability were highly sensitive to a change in plant density from 10 to 30 plants/m2. A modest increase of sowing rate from 130kg/ha to 160kg/ha, which changed the plant density from 20 plants/m2 to 25 plants/m2, increased profitability with a range of - $22/ha to + $254/ha depending on yield and grain price.
These results support a minimum plant density of 15 to 25 plants/m2 in most Australian conditions, and the upper end of this range should be considered in most environments. However, there was variation in the plant density required to maximise grain yield. As a result of this variation, growers can accommodate the plant density to their assessment of the productive potential of a paddock. A key message is that the target plant density should not be ignored or standardised for all situations.
This study has successfully defined the optimal plant density for faba beans for target grain yield. All data in this study is based on experiments, hence results need confirmation at paddock scale. Collaboration between growers and local research organisations to collect data from commercial fields would be beneficial to the industry. Future experiments could explore the interactions of density with other factors such as soil type, row spacing or disease management, but simple density-yield response experiments would have a low return on investment.
Acknowledgements
Nearly all 76 experiments reported in this paper were funded through GRDC investments. The research undertaken as part of this project is made possible by the significant contributions of growers through both trial co-operation and the support of the GRDC, the author would like to thank them for their continued support. Many of the experiments were conducted by Agriculture Victoria, SARDI, Southern Farming Systems and FAR Australia through the Southern Pulse Agronomy program, their efforts are acknowledged with gratitude. Lachlan Lake (SARDI) provided helpful feedback on the paper. James Manson’s PhD studies are supported by the GRDC through a GRDC Research Scholarship.
Contact details
James Manson
University of Adelaide
0413 422 033
james.manson@adelaide.edu.au
@TrialsofJManson
Was this page helpful?
YOUR FEEDBACK
