Developing an ecotoxicologically based index for fertiliser toxicity
Author: Jacinta Dockerill, Michael McLaughlin and Fien Degryse (Fertiliser Technology Research Centre, School of Agriculture, Food and Wine, The University of Adelaide) | Date: 07 Feb 2023
Take home messages
- Utilising ecotoxicological based guidance to avoid fertiliser toxicity and optimise fertiliser application can help maximise crop production and profits
- A plant-focused approach to fertiliser toxicity better simulates real cropping scenarios, generating guidelines which are more realistic and involve less guess work.
- Soil variation in fertiliser toxicity is closely linked to soil characteristics – soil moisture and clay content.
Background
Fertiliser toxicity can be caused by the incorrect or overapplication of crop nutrients and has the potential to limit maximum crop output and profits. This toxicity can be mitigated by following the four Rs of fertiliser use: right source, rate, time and place. The salt index was introduced to help producers select fertiliser products with a lower potential for toxicity (Rader et al. 1943), but it is based on the chemical attributes of fertilisers and does not consider other growth factors affecting toxicity (Murray and Clapp 2004). While the salt index may still be useful, there is an opportunity to utilise ecotoxicological approaches to modernise fertiliser application guidelines, providing more suitable advice based on real plant responses to fertiliser excess. This study analysed the toxic response of canola crops to a range of fertilisers including macro and micronutrients, co-granulated products and organic fertilisers. By studying the growth response of crops to toxic concentrations of fertiliser, we can generate fertiliser use guidelines which reflect in-situ cropping scenarios and provide threshold application rates. This could help advisers to provide clearer information to further reduce the risk of fertiliser toxicity and optimise fertiliser use. This can help growers reduce their input costs while maximising crop output potential and overall profits.
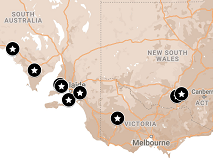
Figure 1. Map showing soil origins.
Method
Ten soils from south-east Australia (Figure 1) with varying characteristics (Table 1) were collected, dried and ground to <2mm. These soils were mixed with 18 different ground fertilisers (<250 μm) (Table 2), at ten increasing rates. The fertilised soil mixes were planted with canola and watered daily to 75% of the maximum gravimetric water content (qg). After 14 days, the above ground plant matter was harvested, dried at 65°C for 48 hours and weighed. Growth response curves were generated to determine 10% and 50% maximal inhibition concentrations (IC10 and IC50). From a soil subsample, 1:5 soil to water solutions were analysed for pH and electrical conductivity (EC).
Table 1: Location and relevant properties of the soils used in the experiments.
Location | Australian Soil Texture (MPM) | Clay % | Silt % | Sand % | pHw | EC dS/m | Org C % | CaCO3 Eqv. % | |
|---|---|---|---|---|---|---|---|---|---|
Black Point | SA | Loam | 14 | 24 | 63 | 8.0 | 0.14 | 1.5 | <0.4 |
Inman Valley | SA | Sand | 1.6 | 4.8 | 94 | 6.0 | 0.04 | 2.9 | <0.4 |
Lock | SA | Loamy Sand | 5.2 | 9.6 | 85 | 9.0 | 0.09 | 0.3 | 36.0 |
Longerenong | VIC | Silty Clay Loam | 39 | 36 | 26 | 8.2 | 0.28 | 0.9 | 4.7 |
Mudamuckla | SA | Loamy Sand | 6.1 | 9.4 | 85 | 8.7 | 0.11 | 1.1 | 19.0 |
Mudamuckla (Salt Patch) | SA | Loam | 13 | 18 | 69 | 8.0 | 1.30 | 1.1 | 22.0 |
Mypolonga | SA | Silty Clay | 50 | 32 | 18 | 7.4 | 0.56 | 5.7 | <0.4 |
Sandilands | SA | Loamy Sand | 6.3 | 13 | 81 | 4.8 | 0.24 | 4.3 | <0.4 |
Tootool | NSW | Loamy Sand | 11 | 24 | 65 | 5.4 | 0.20 | 4.7 | <0.4 |
Wagga Wagga | NSW | Loam | 17 | 23 | 60 | 6.5 | 0.07 | 5.7 | <0.4 |
Table 2: Fertilisers used, including alternative names, manufacturer and published nutrient content.
Fertiliser | Other Names | Manufacturer/ Supplier | N % | P % | K % | Other % |
|---|---|---|---|---|---|---|
NaNO3 | Sodium Nitrate | Ace Chemical Co. | 16.5 | |||
Ca(NO3)2 | Calcium Nitrate, Calcinit® | Yara Australia | 17 | Ca=19 | ||
Urea | Carbonyl Diamine | Impact Fertilisers | 46.6 | |||
SOA | Sulphate of Ammonia | Richgro | 21 | S=24 | ||
MAP | Monoammonium Phosphate | The Mosaic Company | 10 | 21.9 | ||
DAP | Diammonium Phosphate | The Mosaic Company | 18 | 20 | ||
MES 15® | Microessentials 15®, MAP with SOA + S | The Mosaic Company | 13 | 33 | S=15 | |
MES Z® | Microessentials SZ®, MAP with SOA, S + Zn | The Mosaic Company | 12 | 40 | S=10, Zn=1 | |
SSP | Single Superphosphate | Richgro | 9.1 | Ca=20 | ||
TSP | Triple Superphosphate | Impact Fertilisers | 20.7 | Ca=20 | ||
MOP | Muriate of Potash, Potassium Chloride | The Mosaic Company | 60 | Cl=62 | ||
SOP | Sulphate of Potash, Potassium Sulphate | Richgro | 41 | S=17 | ||
Aspire® | MOP + B | The Mosaic Company | 58 | B=0.5, Cl= 58 | ||
Granubor | Sodium Borate | Impact | B=15 | |||
K-Till Extra Plus® | MAP with SOP, MOP, CuO + ZnO | CSBP | 9.2 | 11 | 15 | S=5.1, Zn=0.18, Ca=0.7, Cu=0.07 |
Macro Pro Extra® | MAP with SOP, SOA, CuO + ZnO | CSBP | 9.7 | 11.2 | 11.2 | S=10.2, Zn=0.2, Cu=0.1 |
Dynamic Lifter® | Pelletised chicken litter | Yates | 3.6 | 1.1 | 1.7 | |
Rapid Raiser® | Pelletised chicken litter | Neutrog | 4.0 | 2.5 | 2.5 |
Results and discussion
50% inhibition concentrations (IC50)
We derived the IC10 and IC50 values from growth response curves but predominantly focused on the IC50 – the point at which plant growth was reduced by 50% in comparison to unfertilised controls, as this is the least variable toxicity value from this ecotoxicological approach. Overall, the toxic response of canola, and therefore IC50 values, of each treatment group varied widely among soils and fertilisers (Figure 2). This demonstrates that fertiliser products have inherent toxicity and that soil-fertiliser interactions occur which affect this toxicity.

Figure 2. A summary of all 50% inhibition concentrations (IC50) showing the variation in IC50 minimum and maximum value across the ten soils and the median of these IC50 values.
A Fertiliser Toxicity Index – a comparison of indices
There are two published methods to derive salt indices used to predict fertiliser toxicity: the Rader method (Rader et al. 1943) uses the increase in osmotic pressure () of a fertiliser/soil/water mix and the Jackson method (Jackson 1958) uses the increase in electrical conductivity (EC) of a fertiliser/water solution (equation 1).
Equation 1.
![]()
To compare our results to the existing salt indices, we used the IC50 from each treatment group and indexed them relative to NaNO3 (Equation 2), labelling this the Fertiliser Toxicity Index (FTI).
Equation 2.
![]()
While we cannot directly compare all products due to the age of the original study and resulting lack of extensive published salt indices, when comparing the published indices (Table 3), there is some discrepancy between the toxicity observed in this study and the potential toxicity suggested by the salt index. When comparing the Jackson salt indices to our FTI, there seems to be no correlation between the values, indicating that measuring the EC of a fertiliser solution is a poor predictor of toxicity. In contrast, comparing the published salt indices (Rader et al. 1943) and the median FTI, there is reasonable correlation (r = 0.76), although urea was a notable exception which would indicate that urea causes toxicity via a mechanism not affecting osmotic pressure. Despite the similar rankings between the Rader indices and the FTI, there is still a wide range in the FTI (Table 3) which indicates potential variation in soil-fertiliser interactions.
Table 3: Summary of available salt indices and the range of and median fertiliser toxicity indices.
Fertiliser | Salt Index | Fertiliser Toxicity Index | ||
|---|---|---|---|---|
Rader et al.1 | Jackson2 | Median | Range | |
NaNO3 | 100 | 100 | 100 | |
Ca(NO3)2 | 53 | 90 | 68 | 41-104 |
MAP | 30 | 64 | 40 | 22-67 |
DAP | 34 | 102 | 64 | 24-83 |
MOP | 116 | 139 | 95 | 61-160 |
SOP | 46 | 111 | 26 | 18-66 |
SOA | 69 | 146 | 80 | 44-234 |
SSP | 8 | 63 | 9 | 4-12 |
TSP | 10 | 41 | 24 | 11-33 |
Urea | 75 | 0.1 | 154 | 100-319 |
As this study assessed concentration of fertiliser nutrients in soil and measured plant response to determine toxicity, we can translate the IC50 values generated into application rates. Towards the completion of the project, we hope to generate threshold application guidelines, providing growers and advisers with fertiliser rate limits, which may be adjustable to capture growth conditions and soil variability.
Fertiliser-soil interactions and the effect of soil moisture

Figure 3. A comparison of the 50% inhibition concentrations (IC50) of five fertilisers, SSP, Dynamic Lifter, MAP, MOP and Urea, as a function of (a) the volumetric water content qV (cm3/cm3) or (b) the clay content (%) of the ten soils.
There were a wide range of soil textures included in the study (Table 1), with clay content ranging from 1.6-50%. During the experiment, each pot was watered to 75% maximum gravimetric water content and the toxic response of fertilisers was strongly correlated to the soil moisture and clay content (generally r = >0.65 and >0.75 respectively) (Figure 3). Those soils with high clay content and increased water holding capacity contain more water to dilute fertiliser chemicals. It is also worth noting that calcareous soils from Mudamuckla and Lock were rather sandy and dry but had a unique effect on the toxicity of superphosphates, essentially mitigating toxicity altogether even when these fertilisers were added at excessive (and unrealistic) rates (>195t/ha).
Inherent fertiliser toxicity and toxicity mechanisms
When we normalise the IC50 for soil moisture, to reduce the effect of soil variation, our results still indicate different inherent toxicity for products and different mechanisms of toxicity. For example, a notable exception to the previously mentioned effect of soil moisture on toxicity was found for Granubor treatments. In those treatments, there was a poor correlation between toxicity and soil moisture or clay content (r = 0.43 and 0.57) and instead Granubor toxicity seemed to be affected mainly by soil pH. This is supported by data of literature which indicate that less B uptake occurs at high pH, when the boron anion is prevalent (Hu and Brown 1997).
 toxicity.")
Similar soil-fertiliser interactions seemed to occur for nitrogen (N) fertilisers, like MAP, DAP and urea, added to soils with a higher pH. When comparing the soil pH to the toxicity observed in DAP-treated soils, toxicity did not follow a linear trend. Where the pH was between 7-8.5, lower toxicity was observed (Figure 4). When the soil pH was above 8.5, toxicity was higher and more similar to the treatments where the soil pH was below 7. This is likely the result of different soil conditions once the pH is >8.5. The equilibrium between ammonia (NH3) and ammonium (NH4+) shifts when soil pH is >8.5, resulting in more free NH3 in soil (Figure 5) which induces toxicity. This release of NH3 gas from soil solution causes root death, reduced germination and reduced plant growth.
Conclusion
From this study, we have found that both the fertiliser products and soil characteristics affect toxicity and ongoing analysis is being performed to characterise variable growth conditions and to determine toxicity mechanisms. Generally, clay content and soil moisture seem to greatly affect the toxicity of fertilisers and fertiliser use guidelines that can be adjusted for soil moisture would provide more accurate predictions than salt indices. Fertiliser application recommendations that can also consider the inherent differences in potential toxicity of fertilisers and the other variable growth conditions would be most accurate and useful for growers and advisers. Through our ecotoxicological approach, we have indicated that a toxicity index based on plant growth data may provide more accurate recommendations to growers and advisers, however, more work is needed to capture more variations in growth conditions (for example, different crop varieties, seasonal and variable soil moisture, fertiliser placement in relation to seed) and we will address this in the future. Ongoing work in the area could eventually generate the appropriate data to create useful resources similar to existing rate calculators which consider growers individual cropping conditions. We also note that a fertiliser index or rate recommendation that is based on 50% crop loss is not acceptable to growers and advisers, and ongoing work would need to occur to focus on a lower degree of crop loss (5% or 10% reductions) as a result of toxicity (for example, IC5 or IC10). Despite the limitations of this study, we believe that with ongoing work, ecotoxicologically based fertiliser application guidelines can be very useful. These types of guidelines would help growers to reduce crop production and profit loss caused by fertiliser toxicity and allow advisers to more easily determine which nutrient sources and rates are appropriate for the variable growth conditions experienced by their clients.
Acknowledgements
The research undertaken as part of this project is made possible by the significant contributions of growers through both trial cooperation and the support of the GRDC, the author would like to thank them for their continued support.
References
Hu H, Brown PH (1997) Absorption of boron by plant roots. Plant and Soil 193(1), 49-58.
Jackson ML (1958) Soluble salt analysis for soils and waters. In ‘Soil chemical analysis’. (M. L. Jackson) pp. 227-271. (Prentice-Hall: Englewood Cliffs, N.J.)
Murray TP, Clapp JG (2004) Current fertilizer salt index tables are misleading. Communications in Soil Science and Plant Analysis 35, 2867-2873.
Rader LF, White LM, Whittaker CW (1943) The salt index – a measure of the effect of fertilizers on the concentration of the soil solution. Soil Science 55, 201-218.
GRDC Article on Fertiliser toxicity
Contact details
Jacinta Dockerill
Fertiliser Technology Research Centre
The University of Adelaide
0434 399 359
jacinta.dockerill@adelaide.edu.au
@_JDockerill
GRDC Project Code: UOA2002-012RTX,
Was this page helpful?
YOUR FEEDBACK