Optimisation of canola phenology in diverse Australian growing environments using genomics
Author: Shannon Dillon & Chris Helliwell (CSIRO) | Date: 07 Feb 2023
Take home messages
- Current APSIM-based tools for optimising canola productivity by targeting varietal phenology to the optimal flowering window are limited by the time taken to parameterise new varieties.
- This can be up to several years after release and is further compounded by rapid turnover of canola varieties.
- We leveraged genomic and environmental effects on flowering time to develop a robust hybrid model that brings together machine learning and process-based crop simulation modelling to predict flowering time for any canola variety based on its genome, which substantially speeds up the parameterisation process.
- The new model predicts flowering time for Australian varieties within 1 – 2 weeks of actual flowering in the field (R = 0.95-0.86) and can be generalised to a wide range of environments. This makes it a practical option for growers as a tool for managing region-specific productivity of canola crops based on optimising phenology sooner than is possible with the current industry standard.
Background
Adverse environmental conditions during canola development have the potential to substantially impact yield. In particular, the timing of the onset of flowering is an important driver of productivity. Previous GRDC-funded research at CSIRO established that targeting canola phenology to match the optimal flowering window, thereby minimising the risk of yield impacts due to frost or extreme heat, is critical for maximising canola productivity and profitability (Lilley et al. 2019). In canola, variation in phenology, or the timing of transition through developmental stages from germination to maturity, is driven by both genetic and environmental factors and their interactions. Because of this, it is possible to manipulate genetics to optimise the timing of phenology and target the optimal flowering window (OFW), and this has long been practiced by growers and breeders, by selecting varieties that have desirable phenology traits in a given environment.
There has been significant industry demand for the development of flexible tools that can reliably and efficiently optimise the deployment of germplasm across environments based on knowledge of these effects. Previous research addressing this challenge drove the development of the Canola Phenology Calculator (https://www.canolaflowering.com.au/), a web-based application that helps growers to choose released varieties that target the OFW at their location, based on estimates of flowering time generated via simulation with APSIM (Mason et al. 2017). However, this requires estimation of several phenology parameters that encapsulate the unique genetic response of each variety to temperature, by fitting the relationship between thermal and vernal time to key phenological stages (Figure 1). Currently, this is achieved through resource and time costly field-based assessments of varieties in a range of environments as they are released, delaying optimisation by up to several years. This is compounded by rapid turnover of canola varieties meaning the characterisation process is ongoing.
 are estimated from the model fit of thermal time to flowering and vernal time to transition over multiple environments for each canola variety.")
Figure 1. Three phenology parameters (a-c) are estimated from the model fit of thermal time to flowering and vernal time to transition over multiple environments for each canola variety.
Optimising canola phenology project
The GRDC funded investment, Optimising Canola Phenology for Australian Growing Environments (CSP1901-002RTX), builds on this previous work to deliver a new model framework that leverages genomic SNP information (variations in the DNA sequence among canola varieties) to streamline the parameter estimation step, reducing the dependence of phenology model optimisation for new varieties on field-based assessments, and the time frame in which recommendations on variety selection can be made available to growers. This research explored an alternative approach that integrates genomic prediction and crop simulation modelling, whereby we train a model in a supervised way using observed parameter estimates and SNP data for a large number of varieties. This results in a model that can predict the APSIM phenology parameters using genomic (SNP) data. Since genomic SNP information can be obtained quickly and at relatively low cost, this model can feasibly be used to predict the APSIM phenology parameters for new varieties where only the SNP information is supplied. Predicted parameters are then passed into a simulation model framework using APSIM to predict flowering time across a range of possible environments.
Model training
We recorded phenology in a diverse set of 350 modern Australian and international varieties in a total of 18 site/year/time of sowing (TOS) combinations over four years (Figure 2). To select sites, thermal and vernal accumulation from sowing was simulated for candidate sites and TOS combinations to identify those that gave a spread of environments representing the breadth of thermal and vernal variation across the Australian canola growing region. Observations of four key phenology developmental stages (emergence, leaf appearance, bud-visible and first flower) were made twice weekly. In total, over 400 000 phenology observations were recorded. Phenology parameters were then estimated for each variety based on this data. We also obtained genomic SNP data for each variety using the Brassica 90K genotyping array (Holzworth et al. 2014).
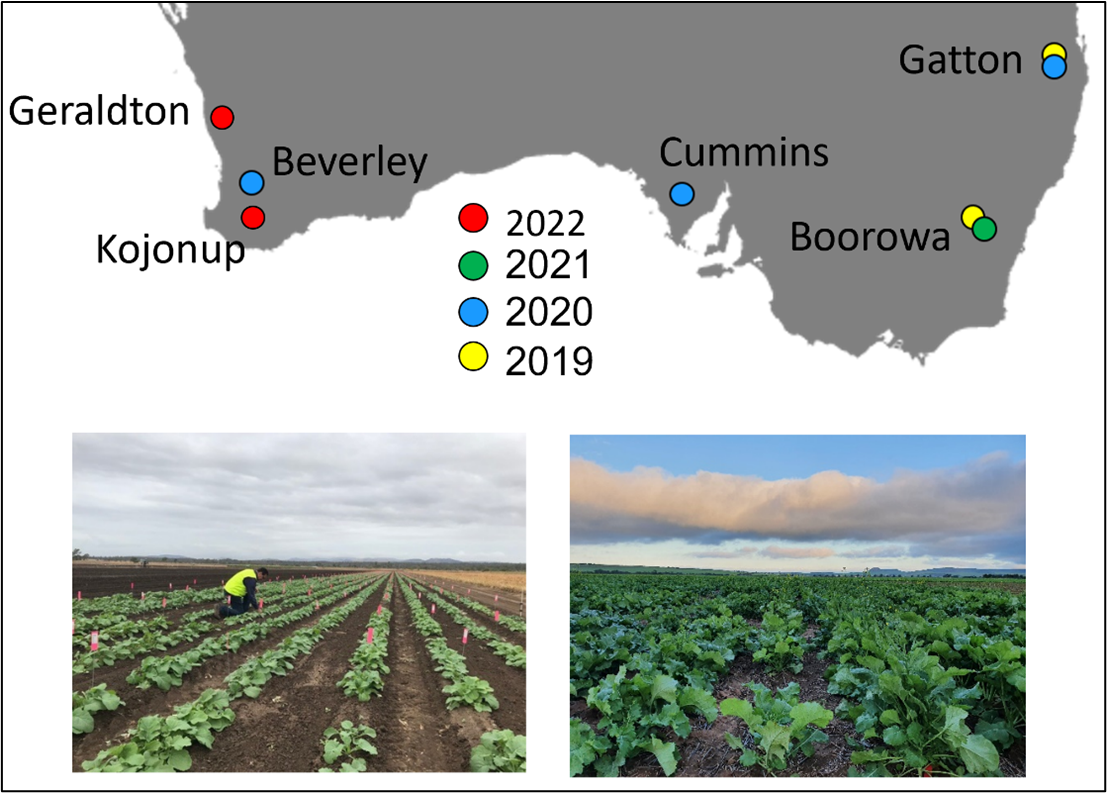
Figure 2. Year and location of trials conducted, with two TOS (mid-April and mid-May) at each site in 2020–2022 and three TOS in 2019 (mid-April, mid-May and mid-June). Trials at Gatton 2020 (left) and Kojonup 2022 shown at bottom.
Genomic models were trained using an ensemble machine learning method Random Forest for each of the three phenology parameters. These parameters were then passed into APSIM-Next Gen (NG) to simulate flowering over a range of environments in a two-step process. The GP-APSIM-NG model was trained and validated under four scenarios (Table 1). The most relevant scenarios for indicating potential for broader application of the tool were scenarios three and four, where the model predicts phenology over a range of environments for new varieties that were not previously observed in model training, based on their genome.
Model performance
The APSIM-NG model predicted phenology with high levels of accuracy across all four scenarios (Figure 3). For scenario one, R = 0.95 overall (0.95 and 0.94 for flowering and green bud, respectively). In scenario two, accuracy dropped to R = 0.93 overall (0.93 and 0.91). In scenarios three and four, overall accuracy reduced to R = 0.87 (0.88 and 0.86 for flowering and green bud, respectively) and 0.86 (0.87 and 0.82), respectively. Overall, Australian lines performed better than international lines, but little difference in prediction accuracy was observed between current unreleased and released lines within the Australian set. This most likely reflects decreased representation of some international variants in the training set.
As a benchmark, performance of the genomic model was compared to that of the alternative APSIM-NG phenology model, which uses phenology parameters empirically estimated in APSIM (rather than using genomics) (Figure 4). For the latter, phenology estimates can only be tested for scenarios one and two, where genotypes were observed in the field. The benchmark predicted flowering and green bud with accuracy of R = 0.95 overall (0.95 and 0.94 for flowering and green bud, respectively) for scenario one, which dropped to R = 0.93 (0.94 and 0.90) for scenario two. It is notable that for scenarios one and two, the only scenarios directly comparable with the traditional APSIM-NG model, the performance of the genomic model was comparable.
When the GP-APSIM-NG model performance was assessed as error in days between observed and predicted flowering, we saw that again the Australian material performed better with similar errors to the APSIM-NG model, with international varieties again showing a much wider distribution in error (Figure 5). Where genotypes were unobserved, error increased to within ~10 and ~11 days on average for scenarios three and four.
Table 1: The genomic optimised crop growth model (GP-APSIM-NG) was trained under four scenarios, which enabled performance of the model to be assessed against different levels of information provided for training.
Observed Genotype (OG) | Unobserved Genotype (UG) | |
|---|---|---|
Observed Environment (OE) | Scenario One E: All environments G: All varieties | Scenario Three E: All environments G: ~100 varieties dropped out each time |
Unobserved Environment (OE) | Scenario Two E: Environments dropped out one at a time G: All varieties | Scenario Four E: Environments dropped out one at a time G: ~100 varieties dropped out each time |

Figure 3. Comparison of observed and predicted phenology using the hybrid crop growth model GP-APSIM-NG, for scenarios one through four. In this case APSIM parameters are estimated from genomic data.

Figure 4. Comparison of observed and predicted phenology using the benchmark APSIM-NG phenology model prediction with parameters estimated from field observations. (Only possible for scenarios one and two where genotypes were observed in the field). This can be compared to the top two panels of Figure 2 to compare model performance when parameters are estimated from field data versus genomic data.

Figure 5. Prediction of flowering time represented as a histogram of predicted values based on error in days (RMSE) for the GP-APSIM-NG hybrid crop growth model.
Current directions
Further improvement of the model, through addition of genomic and phenology data for NVT varieties, is underway as part of a new GRDC investment (CSP2206-012RTX) which will update the existing Canola Phenology Calculator web application with genomically parameterised estimates of flowering time across Australian canola growing regions. This project will also update the existing web app to include genomically optimised phenology estimates for wheat and barley. The new and improved web app is anticipated to be available to Australian breeders and growers by 2027.
Acknowledgements
The research undertaken as part of this project is made possible by the significant contributions of growers through both trial cooperation and the support of the GRDC, the author would like to thank them for their continued support. I would like to also acknowledge members of the CSIRO project team who underpinned the delivery of this work, including Bangyou Zheng, Jeremy Whish, Julianne Lilley, Alec Zwart, Alex Boyer, Andrew Gock, Matthew Nelson, Susie Sprague, Brett Cocks, Emmett Leyne, Bill Bovill, Ian Greaves, Jing Wangand Shannon Dillon (project co-lead).
References
Holzworth DP, Huth NI, deVoil PG, Zurcher EJ, Herrmann NI, McLean G, Chenu K, van Oosterom EJ, Snow V, Murphy C, Moore AD, Brown H, Whish JPM, Verrall S, Fainges J, Bell LW, Peake AS, Poulton PL, Hochman Z, Thorburn PJ and Keating BA (2014). APSIM – Evolution towards a new generation of agricultural systems simulation. Environmental Modelling & Software, 62: 327-350.
Lilley JM, Flohr BM, Whish JPM, Farre I and Kirkegaard JA (2019). Defining optimal sowing and flowering periods for canola in Australia. Field Crops Research, Volume 235: 118-128.
Mason AS, Higgins EE, Snowdon RJ, Batley J, Stein A, Werner C and Parkin IA (2017). A user guide to the Brassica 60K Illumina Infinium™ SNP genotyping array. Theoretical and Applied Genetics 130(4):621-633.
Contact details
Shannon Dillon
CSIRO Agriculture and Food
L2D Synergy Building, Black Mountain Innovation Precinct
ACT 2601 Australia
Ph: 02 6246 4834
Email: shannon.dillon@csiro.au
Chris Helliwell
CSIRO Agriculture and Food
L2D Synergy Building
Black Mountain Innovation Precinct ACT 2601
Ph: 02 6246 5346
Email: chris.helliwell@csiro.au
Date published: February 2023
GRDC Project Code: CSP1901-002RTX, CSP2206-012RTX,
Was this page helpful?
YOUR FEEDBACK