Predicting profitability of summer weed control timing and impact on crop yield potential
Author: Yvette M. Oliver, Rick Llewellyn, Therese McBeath, Andrew War and Michael Moodie | Date: 27 Feb 2023
Key Messages
- Early spraying trials for summer weeds delivered an additional 15-20mm of stored soil water and 10-30kg/ha retained nitrogen compared to leaving weeds uncontrolled.
- Summer weed control in 2022 showed there was a trend towards higher yields in the full weed control treatments than in the ‘no weed control’ treatment, but there was no statistical significance between the treatments likely due to high variation in weed density.
- The $ummer Weed tool can determine the average yield benefits and likelihood of achieving a yield benefit for different spray timings.
Aims
To expand the range of summer weed control timings and their impacts on soil water, nitrogen and crop yield for the $ummer Weed tool.
Introduction
Summer fallow weed control is an increasingly important component of modern cropping systems and has played an important role in how Australian grain growers have profitably adapted to climate challenges (Hunt and Kirkegaard 2011). Although usually shown to increase average profitability, there are many situations where summer weed management and timing decisions are not always clear-cut, and returns from fallow can vary greatly by region, soil type and season (Oliver et al 2010). The cost of control and impact of summer weeds on crop yield is high, with annual revenue loss due to summer weeds in southern and western Australian cropping regions estimated at $350M (Llewellyn et al 2016). Sub-optimal summer fallow weed control has been identified as one of the major reasons for Australian wheat yields not reaching yield potential (Hochman and Horan 2018).
To inform summer weed decisions, which typically take place with uncertainty about the conditions of summer and winter crop seasons, we have applied APSIM-based modelling to produce a tool designed to be used at the time of summer weed control decisions. The $ummer Weed tool produces probabilistic estimates of the three important elements of summer weed impact; soil water, soil nitrogen and subsequent crop yield impacts from summer weed populations and timing options.
Method
Trials
In addition to preliminary field validation trials conducted in Western Australia in 2020–21 (data not presented), trials have been conducted in the southern GRDC region in 2022.
Trial 1 – Wharminda South Australia: dune location, sand, increasing clay from about 0.3m. Summer rainfall (November–March) 2021–22 was 205mm which is significantly higher than the long-term average of 86mm. There was a 71mm rain event on 22 January and a 16mm event on 24 January.
Trial 2 – Bute South Australia: a) dune site, shallow sand with clay and calcrete increasing with depth and b) flat site, a loamy sand over clay. The 2021–22 summer rainfall (November–March) was 127mm, which was slightly higher than the 101mm long-term average. There were large rainfall events on 12 November 2021 (54.4mm) and 21 January 2022 (33mm).
Treatments:
- Full control with follow-up as required (10–17 February and 4–17 March),
- Initial control with no follow-up (10–17 February)
- Delayed control (4–17 March)
- No control
All treatments were treated with knock-down herbicide in early April and a pre-emergent weed spray before sowing. Bute trials were sown to Trifecta TT Canola on the 17/5/22 with 45.5kg/ha MAP, and top dressed with 20kg/ha N as urea on 27/6/22 and 16/8/22 and harvested on 22/11/22. The Wharminda trial was sown to Vixen wheat on 13/5/22 with 80kg/ha DAP and harvested on 6/12/2022.
APSIM simulations are being conducted on the trials using 100-years of seasonal conditions to validate the modelling and show the range of probable yields with different soil water measured in April from the weed control treatments in the trials.
$ummer Weed App
The $ummer Weed app is currently populated with APSIM modelling output based on:
- Different locations (seven sites across Western Australia, South Australia, Victoria).
- Contrasting soils of sand, loam or clay at each site.
- A range of periods in which the target population of weeds can germinate based on rainfall (December, January, February, March) where there are no weeds at other times.
- Different weed types (deep and shallow rooted).
- Difference in weed density (from 1 to 50 plants/m2).
- Differences in maturity of the weed population at the time of assessment (days since typical emergence).
- A range of spray timing options from time of assessment through to various delayed options, compared to no weed control prior to pre-seeding time control.
The modelling is focused on wheat impacts, and the crop was assumed to be sown between 25 April and 30 June when 15mm rain had fallen over five days, with 100 plants/m2 of Mace wheat, sown with 50kg/ha nitrate and a further 50kg/ha 40 days after sowing. The high level of fertiliser was to ensure that only stored water and rainfall were limiting the yield potential, rather than any difference in N due to weeds. The impact of the weed populations on available soil N is reported separately.
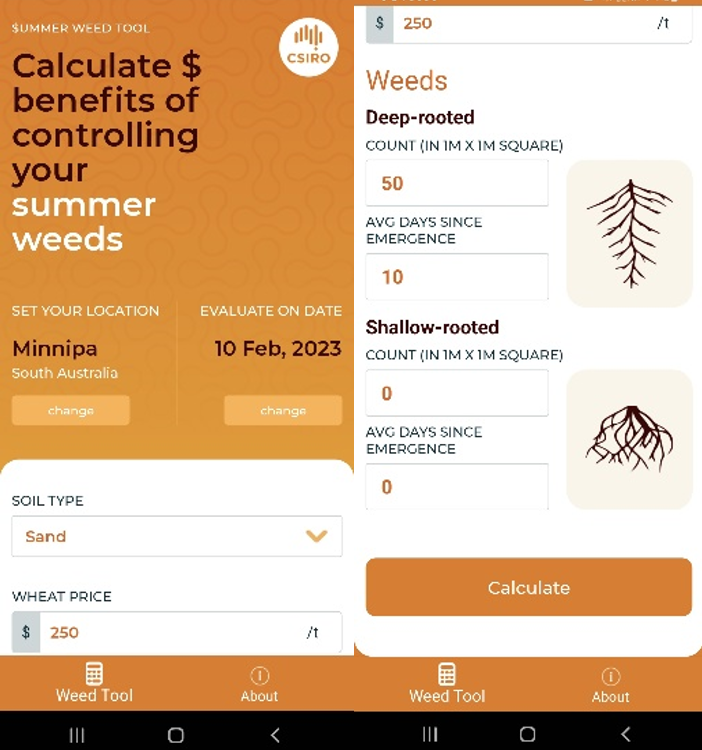
Figure 1. Two screen shots of the $ummer weed app input pages
The app has been designed to mimic the scenario of the user standing in a paddock with summer weeds while inputting the location, date, basic soil type and general weed population characteristics (i.e., density and age of deep or shallow rooted weeds) (Figure 1).
The app then asks the user to compare ‘control now’ and ‘control in X days’ and/or ‘do nothing’ scenarios.
From this input the app chooses the set of simulations to determine the expected yield benefit from the control options, determined by the soil water conditions. The gain in starting N available to the subsequent crop is also estimated. The app uses an adjustable wheat price to determine expected returns from control and presents results as the likelihood of achieving an outcome (e.g., probability of a $20/ha yield gain) as well as expected value (average).
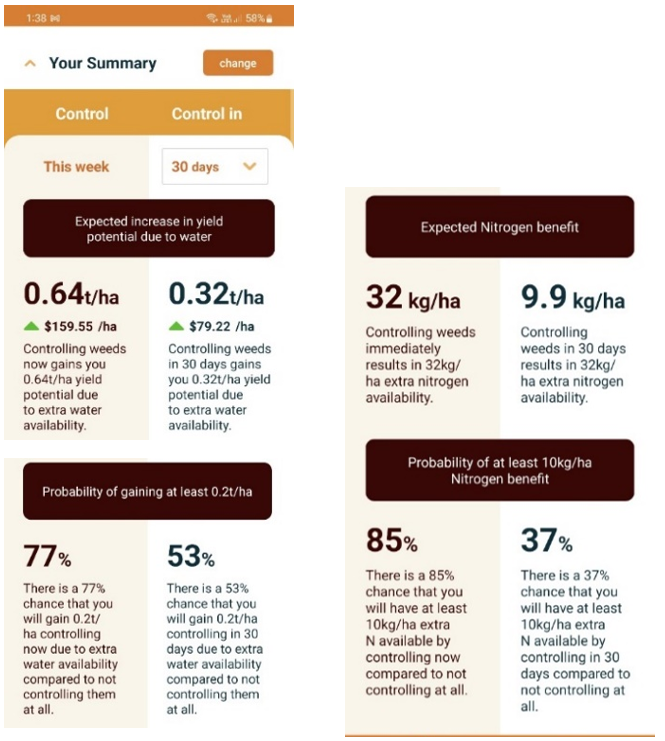
To demonstrate the $ummer Weed app outputs from the Minnipa South Australia site were chosen as the closest site to Wharminda, with inputs of 50 deep-rooted summer weeds/m2 on 10 February that had emerged 10 days beforehand. The app compares scenarios of whether the weeds are killed in that week or in the next 30 days compared to no summer weed control before pre-seeding control. Both sand and loam soil results are shown for comparison. The $ummer Weed app can be downloaded for Apple devices (need to download TestFlight) from https://testflight.apple.com/join/BlR7BqyL and for android devices from https://play.google.com/store/apps/details?id=com.squarev.summerweedtool
Results
Summer rainfall in November and January caused high weed densities and different species at the sites. At Wharminda the average weed density was 206 plants/m2 with blanket weed (79 plants/m2), wheat, (79 plants/m2), Lovegrass (21 plants/m2), capeweed (17 plants/m2), medic (13 plants/m2), and heliotrope (10 plants/m2). At the Bute Dune and Flat sites, the weed densities were 79 and 65 plants/m2 with the dominant weed being wheat (78, 49 plants/m2) and a mixture of large and small Heliotrope (1, 8 plants/m2).
Table 1. Soil water (mm) and soil nitrogen (kg/ha) in the soil profile to 600mm and wheat yield for the different weed control treatments
Treatment | No weed control | Full ongoing control | Initial control with no follow up | Control delayed 30 days | |
Soil water | Wharminda | 101a | 123a | 117a | 110a |
Bute Dune | 79c | 102a | 93b | 88b | |
Bute Flat | 73b | 86a | 75b | 73b | |
Soil N | Wharminda | 20 | 52 | 35 | 27 |
Bute Dune | 77a | 69b | 54c | 54c | |
Bute Flat | 190a | 173b | 171b | 172ab | |
Yield | Wharminda | 0.91a | 1.22a | 1.04a | 1.10a |
Bute Dune | 2.26b | 2.91a | 2.44ab | 2.30ab | |
Bute Flat | 2.21a | 2.38a | 2.45a | 2.34a |
Between February and early April, the uncontrolled weeds used an additional 17–23mm of stored soil water compared to when weeds were fully controlled (Table 1). Even when the weed control was delayed by 30 days, the additional water was 4–10 mm. At Wharminda, there was additional soil nitrate to 0.9m of 30, 13 and 4 kg/ha for the full controlled, initial control with no follow up and delayed control treatments respectively. While the yields were higher in the full weed control plots than the ‘no weed control’ plots (0.2–0.65 t/ha), it was only statistically significant at the Bute Dune site. This is likely due to the high variation in the weed population across the trial.
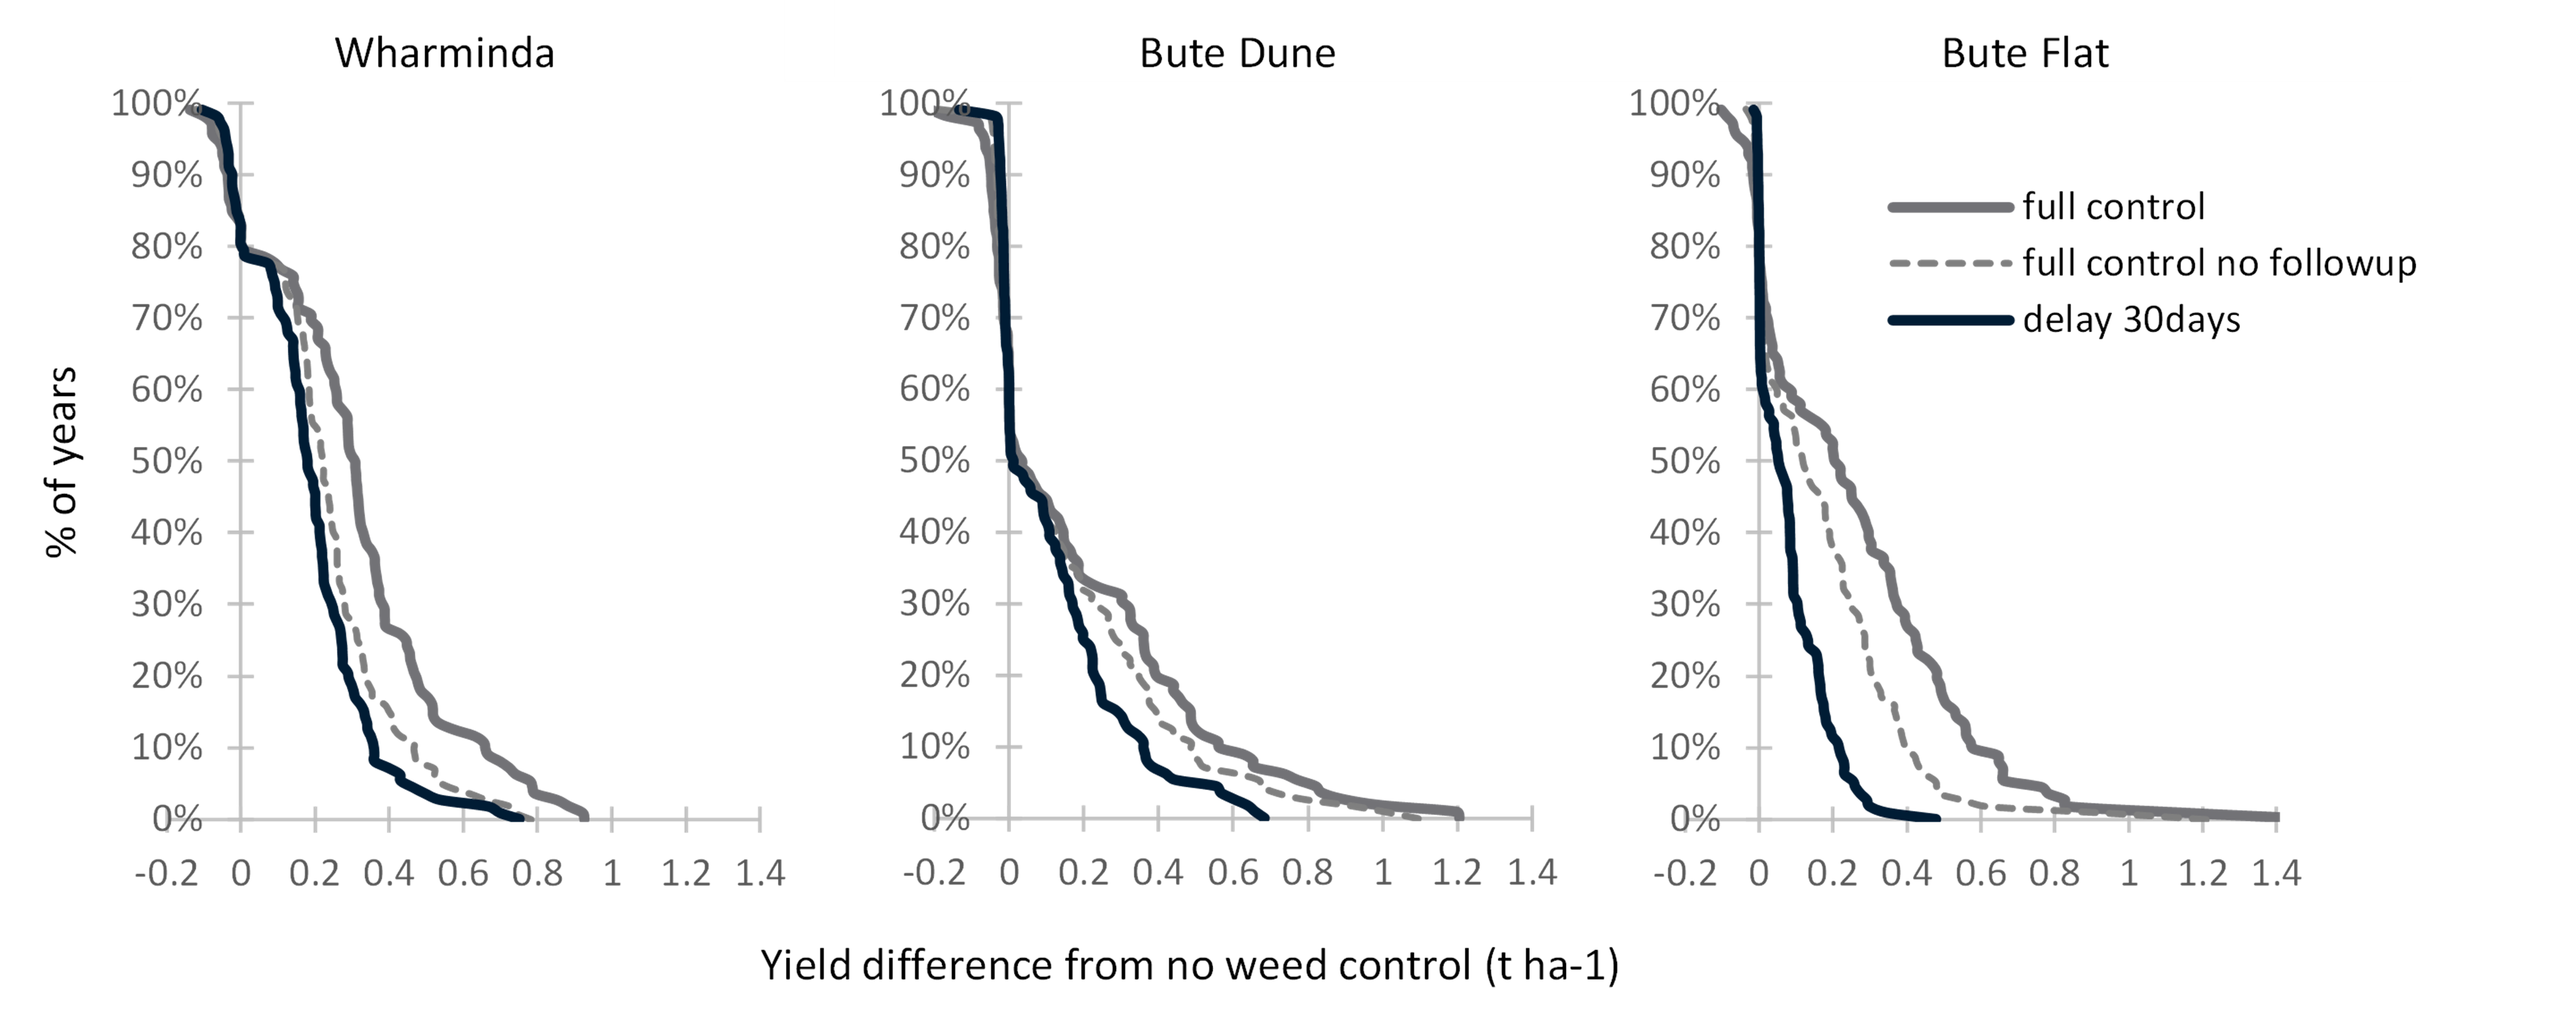
Figure 2. Yield increase (t/ha) estimated using APSIM with different starting soil water measurements, for the treatments and 100 years of climate at Wharminda and Bute
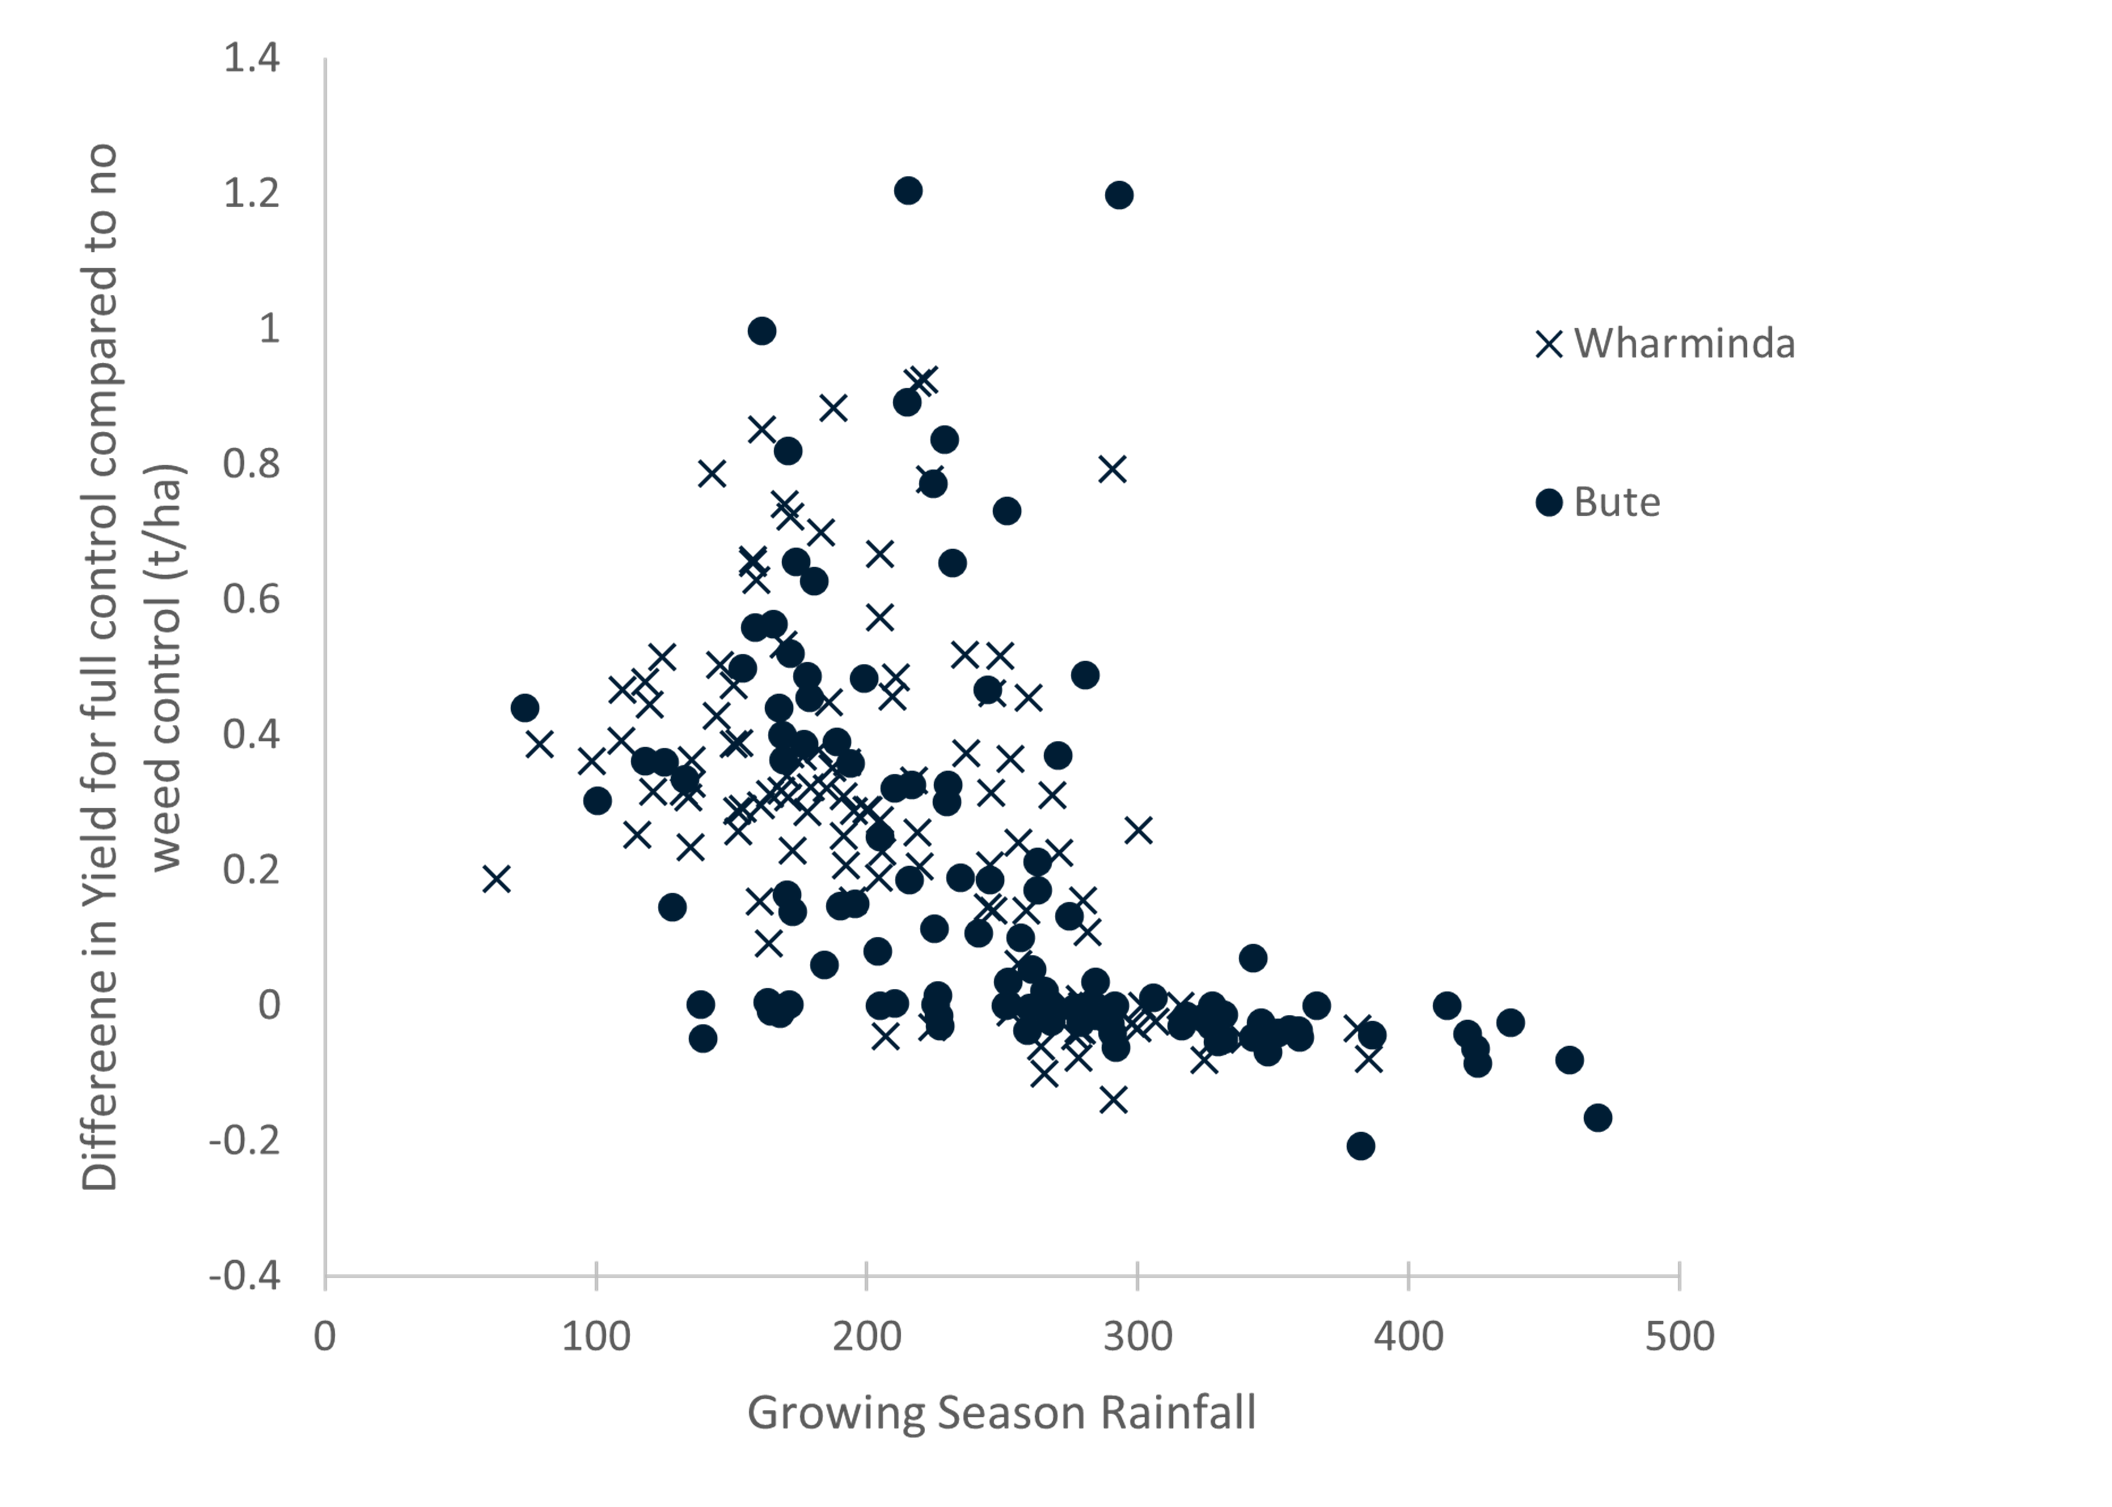
Figure 3. Growing season rainfall (GSR) compared to the APSIM-predicted yield increase (t/ha) for full weed control compared to ‘no weed control’ at Wharminda and Bute using 2020 soil water values
We used APSIM to estimate the effect of the additional water in April along with soil water levels from 100 growing seasons on crop yield (Figure 2). At Wharminda, there was a 50% chance of achieving a 0.31t/ha yield increase from managing weeds completely, 0.22t/ha for early weed control and 0.19t/ha for delaying weed control by a month. In this case, the average and 50th percentile values were similar (Figure 2). There are about 20% of years where there was no yield increase from these differences in soil water, which is likely caused by years with greater than 280mm of GSR (13% of years) (Figure 3).
At Bute, there was less chance of achieving yield increases with these soil water differences as 40-50% of years did not generate any difference in yield (Figure 2). This lower chance of a yield benefit at Bute, may have been caused by the higher GSR where 33% of years had GSR greater than 280mm (Figure 3). However, due to the abnormal distribution, the average yield increase for full weed control was 0.19t/ha at Dune and 0.26t/ha at Flat site and for delayed weed control was 0.12t/ha at Dune and 0.08t/ha at Flat site.
 |  |
|---|---|
| Sand | Loam |
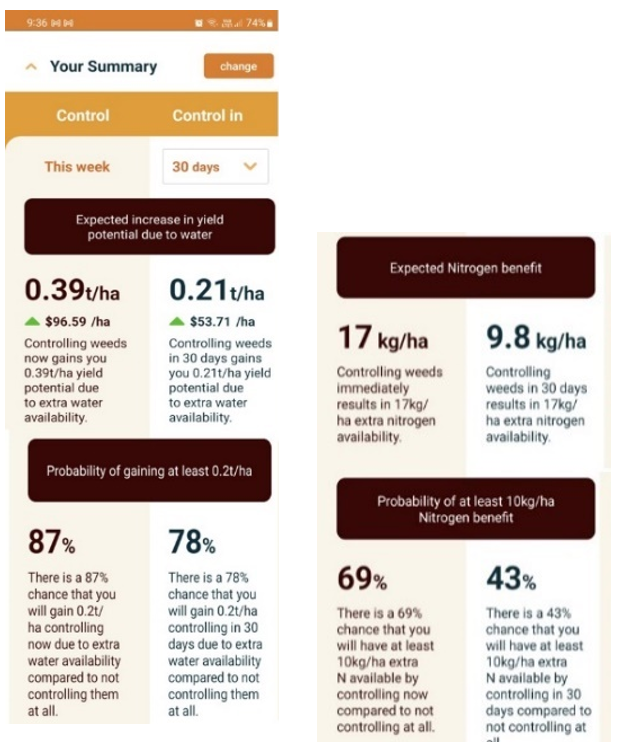
Figure 4. Screen shots of the $ummer Weed app output at Minnipa using a sand and loam soil for the yield and nitrogen benefits
APSIM modelling forms the basis for the $ummer Weed app, however the weeds are grown to create the soil water difference, rather than using measured values as in Figure 2, and only years where weeds germinate are used to estimate the yield differences. An example of the output from the app is shown in Figure 4.
At Minnipa, where 50 deep-rooted weeds were controlled either immediately or in 30 days, yield benefits were less on the sandy soil than the loam soil, due to the lower ability of sandy soils to store water (Figure 4). Delaying weed control by 30 days reduced the yield benefit. A threshold yield benefit of 0.2t/ha (similar to a break-even yield) was achieved in 78–87% of years on the sand even if the weed control was delayed by 30 days. On the loam a 0.2t/ha yield benefit was achieved in 53% of years when weed control was delayed by 30 days. Soil nitrogen was, on average, 17kg/ha higher in the sand and 32kg/ha higher in the loam when weeds were controlled immediately rather than left uncontrolled. However, if weed control was delayed by 30 days then both soils had only ~10kg/ha of additional soil nitrogen compared to no weed control. The likelihood of generating a 10kg/ha increase in soil nitrogen from weed control occurred in 69–85% of years with immediate weed control, but only in 37–43% of years when weed control was delayed (Figure 4).
Conclusion
High summer rainfall at the Wharminda and Bute sites stimulated a high density of weeds which, if left uncontrolled, used 17–20 mm of stored soil water. Whether this additional water also increased yield depended on the subsequent GSR, with the additional stored soil water having little yield benefit when GSR was greater than 280mm. There was a large range of likely yield increases, which highlights the risk of weed management when the GSR is unknown and suggests early season indicators could play a role in summer weed management.
The $ummer Weed app can determine the average yield benefits and likelihood of achieving a yield benefit for different spray timings. It can be used with a range of weed types, densities and spray timings to better understand whether it might be economic to spray immediately or delay spraying for a particular combination of location, weeds and soil type.
References
Hochman, Z. & Horan, H. (2018). Causes of wheat yield gaps and opportunities to advance the water-limited yield frontier in Australia. Field Crops Research. 228, 20–30 (doi.org/10.1016/j.fcr.2018.08.023)
Hunt, J.R., Kirkegaard, J.A. (2011) Re-evaluating the contribution of summer fallow rain to wheat yield in southern Australia. Crop & Pasture Science 62, 915–929. (doi.org10.1071/CP11268).
Llewellyn R.S., Ronning D., Ouzman J., Walker S., Mayfield A. and Clark M. (2016). Impact of weeds on Australian grain production: the cost of weeds to Australian grain growers and the adoption of weed management and tillage practices. Report for GRDC: CSIRO (www.grdc.com.au/ImpactOfWeeds).
Oliver, Y.M., Robertson, M.J., Weeks, C. (2010) A new look at an old practice: Benefits from soil water accumulation in long fallows under Mediterranean conditions. Agricultural Water Management 98, 291–300. (doi.org/10.1016/j.agwat.2010.08.024).
Acknowledgments
The research undertaken as part of this project is made possible by the significant contributions of growers through both trial cooperation and the support of the GRDC, the author would like to thank them for their continued support.
Contact details
Yvette Oliver
CSIRO
Underwood Avenue, Floreat WA
Ph: 9333 6469
Email: Yvette.oliver@csiro.au
GRDC Project Code: CSP2201-005RTX,
Was this page helpful?
YOUR FEEDBACK