Impacts of a wet season on crop nutrition in southern NSW
Author: Jim Laycock (Incitec Pivot Fertilisers) | Date: 16 Mar 2017
Take home messages
- Dentrification loss in soil is determined by length of saturation, soil temperature, soil nitrate levels and levels of labile carbon.
- Plant available nitrate is available in soils through the process of mineralisation which is dependent on soil temperature, total soil nitrogen and soil aeration.
- The conversion from urea to ammonium then plant available nitrate in winter is influenced by microbial activity, soil moisture and soil temperature.
- Waterlogging restricts root development in wheat.
- Soil testing for nitrate and ammonium (and sulphur (KCL-40) for canola) down the soil profile in 2017 is recommended.
- Include total nitrogen % in the 0-10cm soil testing program to assist with long term crop nitrogen budgeting and annual mineralisation budgeting.
- Don’t focus on nitrogen in 2017 to the detriment of sound agronomic planning.
Background
A number of questions have arisen following the above average seasonal rainfall and higher than average grain yields that occurred in 2016:- What is the strategy for nitrogen (N) timing, how much N will be needed in 2017 after the 2016 season and what is the best overall strategy to avoid low protein grades in 2017?
- Should attention be given to other nutrients phosphorus (P), sulphur (S), potassium (K). copper (Cu), zinc (Zn) and soil ameliorants (lime and gypsum)?
- Is there any N left in the tank in long term cropping rotations after 2016 and into the future?
- How much of an effect did denitrification and nitrogen leaching have on crop yield and residual N levels?
- How efficient was my N strategy during 2016 and should I have applied N in September to improve wheat quality?
One thing we can be sure of, 2017 will not be the same as 2016.
Denitrification
Denitrification is the process whereby nitrate is converted to the gaseous dinitrogen or nitrous oxide and subsequently released to the atmosphere. This conversion is carried out by soil bacteria.Denitrification can be a significant mechanism for N loss on medium- and fine-textured soils. It is generally not an issue on coarse-textured soils because they do not remain saturated for any length of time. There are several environmental factors that determine if denitrification will occur and to what extent:
- Nitrate must be present for denitrification to occur.
- Denitrification occurs in wet soils with low oxygen concentrations. Denitrification increases with the length of time the soil is saturated. Standing water may result in a greater percentage of nitrate being denitrified (Figure 1).
- Denitrification occurs at a faster rate on warmer soils, particularly when soil temperature is greater than 24°C and slows as soil temperatures fall below 15°C (Figure 2).
- Denitrification occurs because soil bacteria break down organic matter under low oxygen conditions and the bacteria use nitrate in the biochemical process. Nitrate that resides deeper in the soil profile (for example, below 30cm) where there is less organic matter will have a greatly reduced or minimal probability of being denitrified.
- Denitrification is lower in soils with a pH < 5.0. There is a higher N2 to N2O ratio with alkaline soils and more N2O to N2 in acid soils (less total N lost).
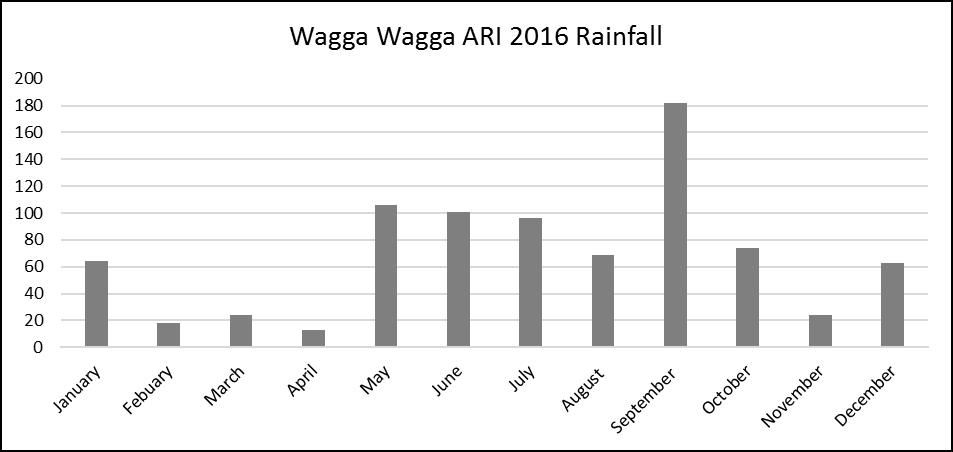
Figure 1. Bureau of Meteorology 2016 growing season rainfall (GSR) 1st April to 30th October.
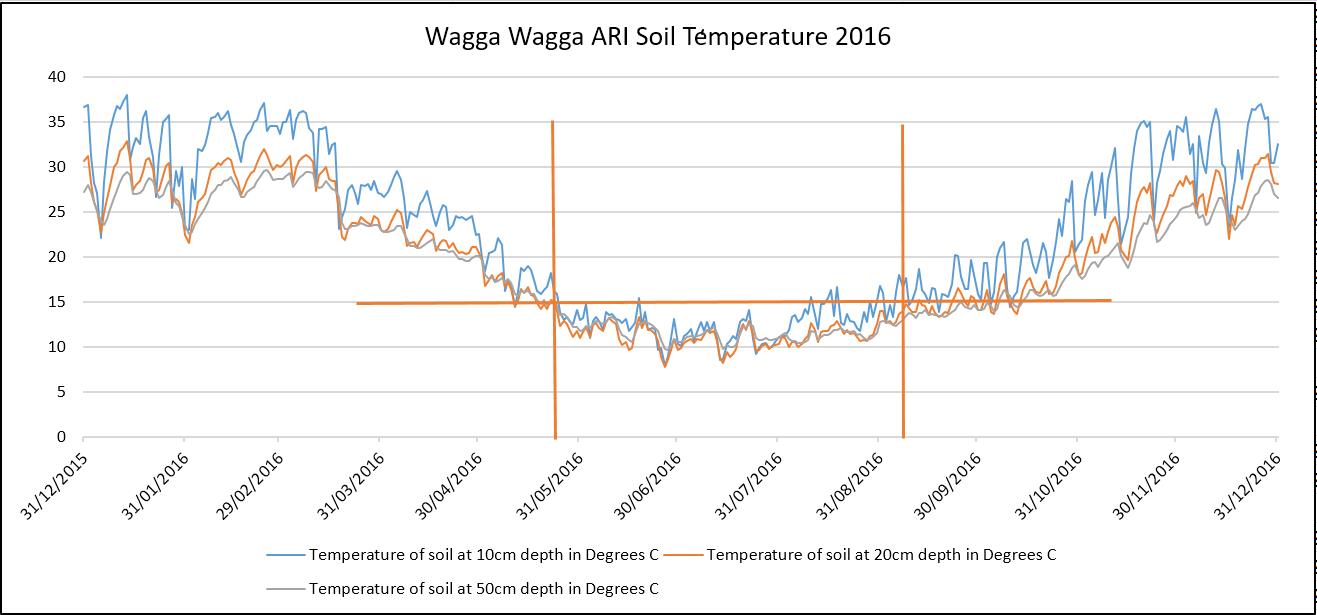
Figure 2. Bureau of Meteorology 2016 Soil Temperature at Wagga Wagga ARI at 3.00pm.
Table 1. Estimated N losses from denitrification as influenced by soil temperature and number of days the soil is saturated. (adapted from Shapiro, University of Nebraska).
| Soil Temperature (oC) | Days Saturated | N loss (% of applied) |
|---|---|---|
| 13 to 15.5 | 5 | 10 |
| 10 | 25 | |
| 24 to 27 | 3 | 60 |
| 5 | 75 | |
| 7 | 85 | |
| 9 | 95 |
Table 1 demonstrates how N loss from denitrification can vary wildly based on soil and seasonal conditions. In addition, currently there is no technology available that measures denitrification at a farm paddock scale on a regular basis. Consequently, I wouldn’t even attempt to nominate a figure as to how much N was denitrified in 2016 within individual paddocks. However, if you are attempting to determine this figure, be aware of the risk factors involved in measuring denitrification and measure soil nitrate levels after a suspected denitrification event.
Leaching
Nitrogen leaching occurs from cropping soils when water drains through the soil beyond the rooting zone.
Any N not taken up by the crop, immobilised in soil organic matter, denitrified or volatilised to gaseous N compounds is susceptible to leaching when drainage occurs. The extent of N leaching will also be affected by the rate that dissolved N moves through the soil profile.
Crop N uptake and soil biological processes often occur at greater rates in the surface soil compared with the sub-soil.
The extent of leaching beyond the surface soil will also vary depending on amount and intensity of rainfall, soil texture and structure and the extent of the crop rooting zone.
Nitrogen can be leached as NO3-, NH4+ and as organic N. It is often assumed that NO3- is more susceptible to leaching than other forms of N as the solid phase of most soils has a net negative charge, and so repels negatively charged anions such as NO3-.
However, organic N leaching can also be significant from agricultural soils (Murphy et al., 2000).
Sampling of Western Australian cropping soils (Wong et al., 2005) demonstrates the variable nature of nitrate leaching due to seasonal conditions and soil types (Table 2).
Table 2. Leaching of nitrate (kg N/ha) from different soil types encountered on-farm in WA.
| Soil Type | 1999 | 2000 | 2001 | 3 yr Total |
|---|---|---|---|---|
| Loamy sand | 20.0 | 0.0 | 0.0 | 20.0 |
| Duplex | 14.9 | 1.9 | 2.8 | 19.6 |
| White sand | 19.6 | 7.3 | 17.0 | 43.8 |
| Yellow sand | 18.2 | 8.9 | 9.5 | 36.6 |
| Gravelly loamy sand | 25.5 | 5.7 | 7.2 | 38.5 |
Closer to home on a Red Kandosol at Wagga Wagga (Smith et.al., 1998) found that the amount of water in the soil profile was the dominant effect on the amount of drainage and nitrate movement beyond the root zone. 1993 was a year of high drainage and there was <25 mm difference in drainage at 0-25cm and 0-90cm.
In the 1993 season the soil profile was wet at the autumn break, the subsoil reached its drained upper limit early in the season and consequently inputs of water from the surface soil displaced an equal amount of water initially present in the subsoil.
In contrast, soil water storage was 70mm less than the drained upper limit at the autumn break in 1995, due to the drought in the preceding year. Under these conditions, drainage from the surface (0-25cm) was stored in the subsoil until it reached the drained upper limit, thereby buffering drainage at 0-90cm. The buffering of the flow of water and soil NO3- may have provided the plants with the opportunity to assimilate the N and prevent it escaping from the root-zone.
Nitrate leached below 0-25cm was 31 and 77kg N/ha in 1993 and 1995, but only 4kg and 12kg N/ha respectively leached beyond the root-zone.
Soil profile sampling for nitrate in 2017 will assist in identifying whether nitrate leaching was an issue in 2016.
Mineralisation
Mineralisation and nitrification of plant residue nitrogen have been shown to occur mainly in the topsoil, due to relative immobility of NH4+ and deposition of plant residues on the soil surface.
For example, 64% of nitrogen mineralisation and 50% of nitrification in the soil profile of a loamy sand, and 78% of nitrogen mineralisation and 41% of nitrification in a sandy clay loam occurred in the top 5-cm soil layer (Murphy et al., 1998).
Mineralisation rates are reduced where soil temperatures are less the 15°C and soils are at less than wilting point or at 60-70% water filled pore space.
Research has also shown that N supplied from mineralisation in modern continuous cropping systems is declining (Angus 2013). Angus (2013) suggested that with continuous cropping, the N-fertiliser application rate on dryland crops in south eastern Australia will need to double in about 4 decades because N supplied from mineralisation is declining.
Mineralisation of nitrogen tends to be highest when soils are warm and wet — typically in late spring while crop demand for N tends to peak in late winter (Angus 2015).
Closing out N budgets (Table 3) from 2016 suggested that mineralisation may have only been supplying 15-20kgN/ha in some of the lower rainfall Mallee cropping environments, while up to 100kgN/ha was supplied in higher rainfall regions of northern Victoria on paddocks with pulse crops in the rotation.
To assist with long term N management in cropping rotations measure total soil N in the top 10cm to provide additional data to enhance N management decisions.
Table 3. Closing out N budgets for growers located in various areas (Source: Agronomy Solutions Group, Incitec Pivot Fertilisers soil, stubble and grain nutrient analysis January 2017).
| Murchison Wheat | Mallee (good protein) | Mallee (low protein) | Murchison canola | |
|---|---|---|---|---|
| Starting Soil N | 220 | 20 | 20 | 158 |
| OC% | 2.3 | 0.4 | 1.1 | 2.1 |
| Total N% | 0.184 | 0.032 | 0.088 | 0.168 |
| Total soil N | 2208 | 384 | 1056 | 2016 |
| GSR mm | 511 | 349 | 349 | 511 |
| Mineralised N | 88 | 10 | 26 | 81 |
| Fert N | 60 | 104 | 104 | 92 |
| Total N supply | 368 | 134 | 150 | 331 |
| Grain yield (t/ha) | 8 | 3.4 | 4.9 | 3.6 |
| Grain protein | 11.9 | 11.8 | 8.7 | 20.3 |
| Grain N | 167 | 70 | 75 | 117 |
| Stubble yield (t/ha) | 7.3 | 3.4 | 4.3 | 6.0 |
| Stubble N% | 1.1 | 0.29 | 0.22 | 1.1 |
| Stubble N | 80 | 10 | 10 | 66 |
| Total above ground N demand | 246 | 80 | 84 | 183 |
| N transfer efficiency grain | 45% | 53% | 50% | 35% |
| N transfer efficiency tops | 67% | 60% | 56% | 55% |
Waterlogging
Research from Western Australia (Palta et.al., 2007) produced results that helped understand the effect waterlogging has on the performance of wheat. After a 12 day period of sub-soil waterlogging the growth of wheat roots was halted.
After water was drained from the soil profile it was three days before wheat roots started growing again, at a considerable cost in carbon (C) and N availability for tiller production and maintenance. As a result ear number and grain yield were lower than those of non-waterlogged plants.
When urea was applied immediately after waterlogging ceased, the wheat plants used only 10% of the applied N. When the same amount of N was applied 21 days after waterlogging 55% of the N was used due to new roots growing during the post waterlogging period.
If wheat root tips are dead due to waterlogging, urea application should be planned around expected accelerating growth period, and therefore, timing the urea application to provide nitrate to plants during a period of new root growth.
Tales from the 2016 Grenfell trials
The Grenfell trial was established on a Red Kandosol soil type, north-west of Grenfell in 2007. The trial was a simple N*P rate trial with 25 treatments (Figure 3) replicated four times (100 plots, dimensions 1.5*20m).
In 2015 the 20m plots were reduced to 10m plot length. 2007 treatments continued to be applied to a smaller plot (10m*1.5m plots) and the 2015 treatments (Figure 4) were applied to the other 10m*1.5m plots over the top of the previous 2007 treatments. As an example, where 400kg/ha/P had been applied over a 10 year period, 0kg/ha/P was applied to half of that 20m plot established in 2007 from 2015 onwards. Fifty per cent of the N rate is applied banded below the plant line at planting and the balance is topdressed at growth stage (GS)31.
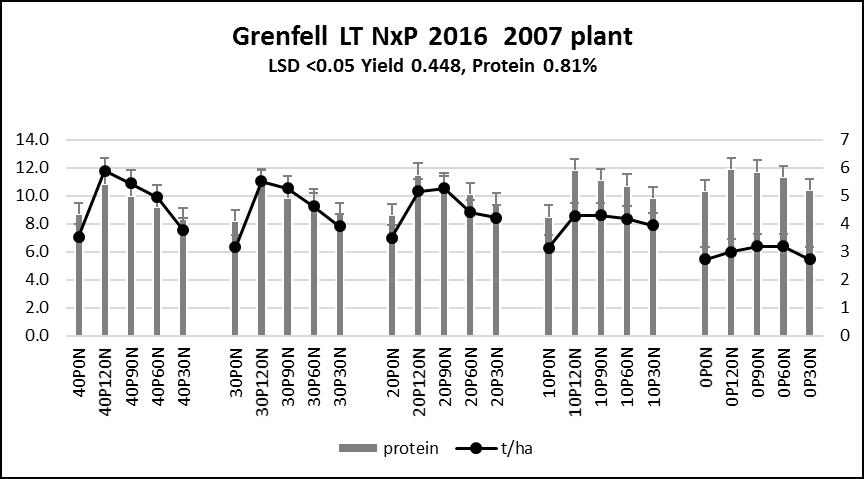
Figure 3. 2016 Grenfell trial results (2007 planting).
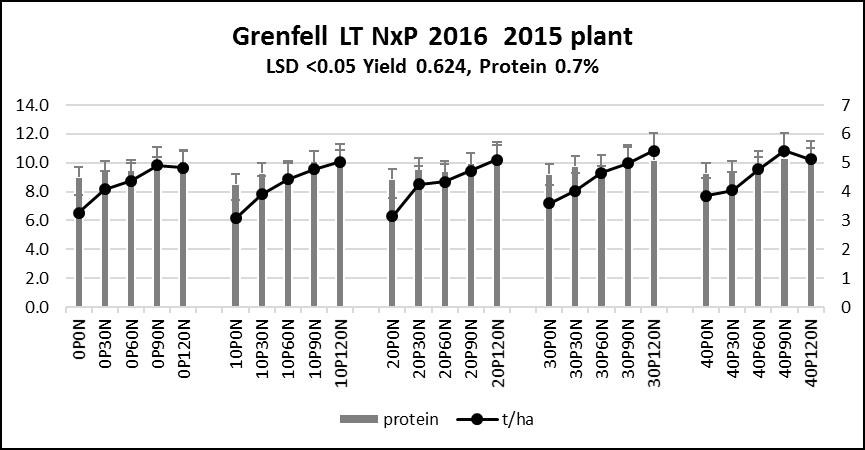
Figure 4. 2016 Grenfell trial results (2015 planting).
Results
- Wheat on wheat is not a good rotation in an above average season!
- After 10 years the 20P/60N treatment is running a deficit of 296kg/ha/N — based on N input and grain N removal. In only two years out of the last 10, N inputs exceeded outputs.
- After 10 years the 20P/120N treatment is running a surplus of 44kg/ha/N — based on N input and grain N removal.
- After 10 years the 10P treatment is running a surplus of 33kg/ha/P — based on P input and grain P removal.
- After 20 years the 20P treatment is running a surplus of 122kg/ha/P — based on P input and grain P removal.
The N budgeting process trialled at Grenfell does not take into account losses and/or gains from mineralisation, denitrification, leaching processes or pulse crop N inputs (Albus lupins in 2010). However, it does demonstrate the negative N balance common to many long term cropping paddocks.
The nitrogen bucket no longer is runneth over!
Tales from the 2016 Milvale trials
At Milvale in 2016 there was a dry matter by N rate interaction (data not shown) irrespective of placement or product.At this site in 2016 application of nitrogen at GS31 and GS65 increased grain protein and moved grain into higher grades (Figure 5).
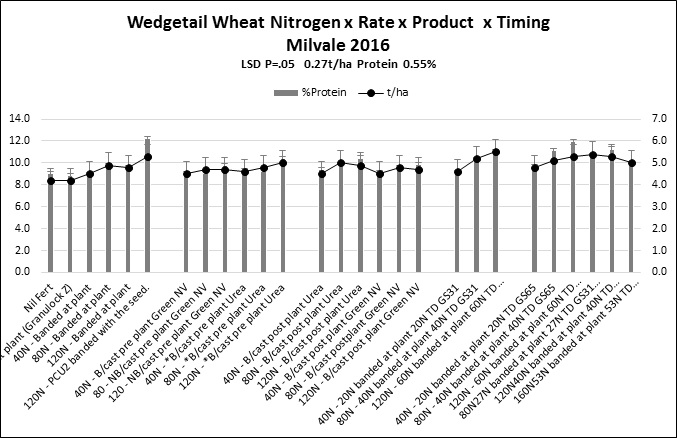
Figure 5. Milvale grazing trial.
Conclusion
One thing is for sure the 2017 season will be different to other seasons, as no two seasons are ever exactly the same. It is important that you manage N with all the tools that are available to ensure other nutrient deficiencies are not limiting N use efficiency. Complete the soil testing program in time to make early nutrient application decisions. Do a N audit — if you have deep N levels from the start of the 2016 season and harvest N removal levels, an approximation of mineralisation and N use efficiency can be calculated. Sample soil N profile in increments to see where the N is located. If shallow, hold off N application, if deep go early with N. Be proactive with N application — get N application on canola out of the way early. Don’t compromise time of sowing by applying N before planting. Plant on time with P and Zn if needed and then apply N. Top-dressed N losses from urea application in winter crop on neutral to acid soils in southern NSW are very low.2016 was a big year for nutrient removal (Table 4). Soil testing at 0-10cm will assist in identifying any developing nutrient deficiencies, also include total N % in your 0-10cm soil testing program in 2017.
Table 4. Nutrient removal and fertiliser equivalent calculated using grain nutrient levels for an 8t/ha Riverine Plains 2016 wheat crop.
| Nutrient | Grain nutrient % | Grain removal (kg/ha) | Fert. equivalent |
|---|---|---|---|
| Nitrogen | 2.1 | 167 | 363kg/ha urea |
| Phosphorus | 0.19 | 15.2 | 70kg/ha Granulock Z |
| Potassium | 0.33 | 26.4 | 53kg/ha MOP |
| Sulphur | 0.14 | 11.2 | 55kg/ha Granam |
| Zinc | 15mg/kg | 120g/ha | Granulock Z |
Acknowledgements
Thanks to Duncan Landers and Lachlan Caldwell for trial sites in 2016 and thanks also to Kaylx for managing sites and providing statistical analysis.References
Murphy DV, GP Sparling, IRP Fillery (1998) Stratification of microbial biomass C and gross N mineralisation with soil depth in two contrasting Western Australian agricultural soils. Australian Journal of Soil Research (1998) 36:45-55.
Smith CJ, Dunin X, Zegelin C and Poss, R (1998). Nitrate leaching from a Riverine clay soil under cereal rotation. Aust. J. Agric. Res., 1998, 49, 379-89.
Joshua WD, Blasi M and Osborne GJ (2001). Simplified functional model for estimating nitrogen mineralisation and leaching in biosolids-amended soils. Australian Journal of Experimental Agriculture (2001) 41(8) 1207 – 1216.
Baldock J (2003) Match fertiliser rates with available water. Farming Ahead 140, 40-43.
Dalal RC, Weijin W, Robertson GP, Parton WJ (2003). Nitrous oxide emission from Australian agricultural lands and mitigation options: a review. Australian Journal of Soil Research 41, 165-195.
Barton, Louise, Scanlan Craig and Hoyle, Frances. Where does the nitrogen go? Soil sources and sinks in Western Australia cropping soils. The University of Western Australia and Department of Agriculture and Food Western Australia, GRDC Project Number: UQ00079.
Hay, Paul C (2015). Know now University of Nebraska Extension Know how, May 26th 2015 .
Murphy, D.V., A.J. Macdonald, E.A. Stockdale, K.W.T. Goulding, S. Fortune, J.L. Gaunt, P.R. Poulton, J.A. Wakefield, C.P. Webster, and W.S. Wilmer. (2000). Soluble organic nitrogen in agricultural soils. Biol. Fertil. Soils 30:374–387.
Wong MTF, Asseng S, Zhang, H (2005) Precision agriculture improves efficiency of nitrogen use and minimises its leaching at within-field to farm scales. Precision Agriculture ’05. Stafford, J.V. (Ed) Proceedings of the 5th European Conference on Precision Agriculture. Wageningen Academic Publishers, The Netherlands. June 2005, pp 969-976.
Paterson J (2007) Unravelling the roots of waterlogged wheat. Farming Ahead 180, 44-45.
John Angus (2013). Meeting the cropping system's demand for nitrogen - Can we do it and manage the profit risk? https://grdc.com.au/Research-and-Development/GRDC-Update-Papers/2013/02/Meeting-the-cropping-systems-demand-for-nitrogen-Can-we-do-it-and-manage-the-profit-risk
John Angus (2015). Model your nitrogen to account for in-crop mineralisation. https://grdc.com.au/Media-Centre/Media-News/South/2015/06/Model-your-nitrogen-to-account-for-in-crop-mineralisation
Contact details
Jim LaycockIncitec Pivot Fertilisers
0427 006 047
jim.laycock@incitecpivot.com.au
Was this page helpful?
YOUR FEEDBACK