Can crop sensors help make nitrogen management decisions?
Author: Jonathan Richetti, André Colaço, and Roger Lawes | Date: 11 Feb 2020
Key messages
- When the percentage of nitrogen in crops drops below four per cent, the crop is nitrogen stressed and more nitrogen fertiliser needs to be applied to avoid yield loss and low protein wheat.
- We have developed a technique using crop sensors and machine learning to predict percentage nitrogen in crops.
- When deployed, this technique can help decide whether more nitrogen fertiliser needs to be applied.
Aims
This work aims to create a reliable estimate of percentage nitrogen (%N) in a wheat crop, using sensors and machine learning, to inform an in-crop application of nitrogen (N) fertiliser.
Introduction
The mid-season N decision is crucial for crop management and profitability. Many tools and decision aids have been developed to help inform a N decision. Most of these rely on making an assessment based on tissue analysis at mid-season to determine plant N status and future requirements. The fertiliser requirement is then calculated from these variables to determine the demand. Unfortunately, it can be difficult to identify the N demand across an entire paddock. Crop sensors and information like normalised difference vegetation index (NDVI) have been commonly used to calibrate a relationship between the vegetation index and potential yield using a linear regression. From this, a N demand can be calculated and used to inform a fertiliser recommendation. However, Colaço & Bramley (2019) showed that such sensor calibration, i.e. the relationship between the vegetation index (usually the NDVI) used and the yield is site-year specific. The implication is that the demand estimate generated from other paddocks, or seasons, is likely to be incorrect in the current year. Therefore, as mentioned, linear regressions are not enough to pick up the complexity of N decision. Here we evaluate the ability to predict %N in the crop at Z31 using a range of different crop sensors and different approaches to machine learning. In this preliminary study, fertiliser decisions were based on whether the crop met a critical %N threshold of four per cent.
Method
Eleven fields were monitored under a Mediterranean climate: three fields in Western Australia (WA) with rainfall varying from 300 to 600mm annually and eight in South Australia (SA) with annual rainfall varying from 330 to 500mm (Jeffrey, Carter, Moodie, & Beswick, 2001). Each field had very different management, weather and soil conditions (Table 1).
Table 1. Average condition of each field monitored
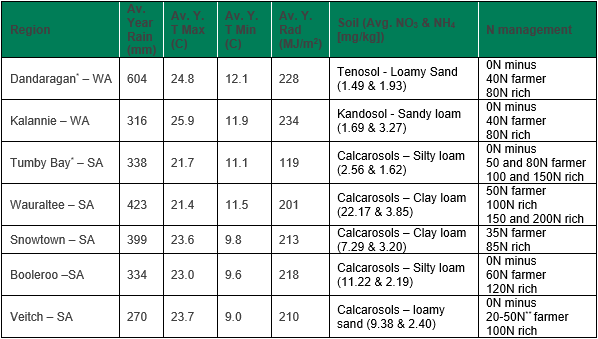
Av. = average; Y. = year; T. = temperature; Rad = solar radiation; WA = Western Australia; SA = South Australia; Average weather from the nearest weather stations (https://www.longpaddock.qld.gov.au/silo/point-data/)*more than one field **variable rate
In each paddock two (N-rich and N-farmer) or three strips (N-rich, where N-rich is the double of N-farmer, N-minus, and N-farmer practice) were set and at least two samples in each strip were collected depending on the size of the paddock. Each sample consisted of 1m2, first scanned with a commercial proximal crop sensor and then cut and sent to an independent private laboratory to assess aboveground plant N concentration (Table 2).
Table 2. Variables and their sources used in the study
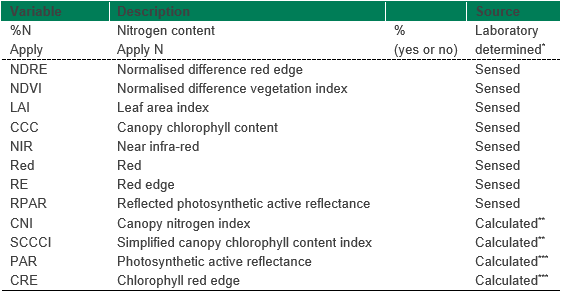
*If %N<4% then Yes, otherwise No;**CNI=1.86*CCC-0.346 (Fitzgerald, Rodriguez, & O’Leary, 2010); SCCCI=NDVI⁄NDRE ; *** From sensor manual.
To address the mid-season N decision, i.e. to identify if a site needed mid-season intervention (a binary decision: yes, wheat needs more N or no, there is no need to apply N), a stressed N content threshold of four per cent was considered based on Australian guidelines (Brennan & Scanlan, 2017). The random forest algorithm (RF), a machine learning method, was used to identify the most important predictors with a Recursive Feature Elimination (RFE) to assess %N and then a logistic regression was performed with the optimum predictors to assess the need for mid-season N application.
Results
From the RF and RFE algorithms the optimum predictors were determined: Red Edge (RE) and Simplified Canopy Chlorophyll Content Index (SCCCI). With those the logit regression showed that the Red Edge reflectance was the significant predictor (Table 3).
Table 3. Logit analysis of deviance with optimum variables
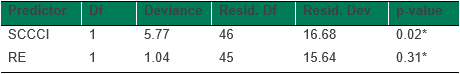
*: significant at 0.05 ns: not significant; SCCCI: Simplified canopy chlorophyll content index; RE: Red Edge
Due to the logit coefficients (Table 4) the results can be used to assess the requirement for a mid-season N application.
Table 4. Logit coefficients to assess mid-season N need
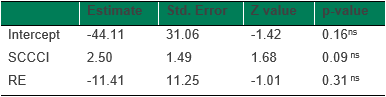
*: significant at 0.05 ns: not significant; SCCCI: Simplified canopy chlorophyll content index; RE: Red Edge
This result is a combination of the best of both words, the high accuracy of machine learning with the interpretability of the traditional methods. The RF showed that the Red Edge and Simplified canopy chlorophyll content index were the optimum predictors of %N. The logistic regression showed that only Red Edge was significant at identifying the need of mid-season N in wheat. When tested against laboratory data the model accuracy was 96%, thus the model was able to correctly determine 96% of the time if the wheat was stressed and in need of more N.
Conclusion
The presented methodology can help farmers use red edge reflectance and SCCCI as indication of N deficiency or N sufficiency in wheat. The proposed method will be applied this season and to identify if there was significant difference on yield. After that, the next step is to develop apply the method and assess differences in yield, and to develop methodology to determine the optimum amount of N needed.
Acknowledgments
This work was supported by Grains Research and Development Company (GRDC) under the Future Farm Project (Project Number: 9176493). Authors are thankful to the farmers who contributed sites for the study.
References
Brennan, R., & Scanlan, C. (2017). Monitoring plant nutrition levels. Retrieved from Monitoring plant nutrition levels website: https://agric.wa.gov.au/n/2988
Colaço, A. F., & Bramley, R. G. V. (2019). Site–Year Characteristics Have a Critical Impact on Crop Sensor Calibrations for Nitrogen Recommendations. Agronomy Journal, 111(4), 2047. https://doi.org/10.2134/agronj2018.11.0726
Fitzgerald, G., Rodriguez, D., & O’Leary, G. (2010). Measuring and predicting canopy nitrogen nutrition in wheat using a spectral index-The canopy chlorophyll content index (CCCI). Field Crops Research, 116(3), 318–324. https://doi.org/10.1016/j.fcr.2010.01.010
Jeffrey, S. J., Carter, J. O., Moodie, K. B., & Beswick, A. R. (2001). Using spatial interpolation to construct a comprehensive archive of Australian climate data. Environmental Modelling and Software, 16(4), 309–330. https://doi.org/10.1016/S1364-8152(01)00008-1
Contact details
Jonathan Richetti, CSIRO
147 Underwood Avenue, Wembley, WA 6014
08 9333 6375
jonathan.richetti@csiro.au
GRDC Project Code: CSP1803-020RMX,
Was this page helpful?
YOUR FEEDBACK