Targeting improved partial resistance using yield-loss response curves for foliar diseases of wheat
Author: Manisha Shankar, Karyn Reeves, Jason Bradley, Ryan Varischetti, Greg Platz, Lisle Snyman, Grant Hollaway, Melissa Cook, Nick Poole, Tracey Wylie, Andrew Milgate, Zhanglong Cao and Robert Loughman | Date: 20 Feb 2020
Key messages
- Current resistance categories were well reflected in the yield responses observed for various wheat foliar diseases however, yield losses for particular resistance categories varied by disease and disease intensity.
- Disease expression increased with the susceptibility of varieties, resulting in correspondingly higher yield loss.
- Partially resistant varieties differed in the extent of their yield loss corresponding with lower disease expression.
- Partial resistance was effective in reducing losses from all diseases depending on the type and severity of disease and the yield potential.
- An online model has been developed so growers and consultants can make more informed decisions about variety and paddock selection by comparing yield responses to various resistance categories of individual diseases.
Introduction and Aims
Western Australia produces about 60 per cent of Australia’s wheat exports. Foliar diseases remain a concern in wheat production and breeding for disease resistance is crucial to reduce yield vulnerability. Many foliar diseases can be effectively controlled by growing partially resistant varieties. In some environments, avoiding the susceptible and very susceptible varieties could be sufficient. Consequently, there is an ongoing need to understand the contribution of partial resistance to disease management in various environments. Cultivar resistance ratings provide critical information but less is known about yield losses from diseases under different scenarios of partial resistance. This paper reports on wheat foliar diseases of priority cereal diseases for the northern, southern and western cropping regions of Australia. The aim was to generate response curves describing the change in yield due to changing intensity of key diseases across a range of partial resistances.
Through the research we have developed disease response curves that indicate the potential yield losses associated with various resistance levels for wheat yellow spot (WYS) (syn. yellow leaf spot, tan spot), nodorum blotch (WNB) (syn. Septoria nodorum blotch, Stagonospora nodorum blotch, Parastagonospora nodorum blotch), leaf rust (WLR), stem rust (WSR) and stripe rust (WYR). As a result, growers will have improved wheat production and/or system cost efficiency through better knowledge of effective management decisions that consider regional economic thresholds.
Method
Thirty-one trials in total were carried out from 2015 to 2018. Of these, ten trials were for WYS with three carried out in South Perth WA, two in Horsham Victoria (VIC), two in Wagga Wagga New South Wales (NSW) and three in Hermitage Queensland (QLD). Four trials were done for WNB in South Perth WA. Eleven trials were done for WLR, of which four were done in Carnarvon WA, three in Inverleigh VIC and four in Wellcamp QLD. Finally, four trials for WSR were done in Carnarvon WA and two trials for WYR were done in Wagga Wagga, NSW. Trials were sown into stubble-free paddocks at a sowing time typical of the region. Trials were carried out using five or six varieties representing resistant levels typically in the range of MRMS to VS. Varieties selected were adapted to the particular region, had similar maturities and where possible were resistant to diseases that were potential contaminants. Trial design and disease establishment for the leaf spot diseases (WYS and WNB) differed from those for the three rusts (WLR, WSR and WYR).
Trial design and disease establishment for leaf spot diseases (WYS and WNB)
Trial design
Each trial was sown in a randomised criss-cross or split-plot design of five disease levels, five or six resistance levels and three replicates. Disease epidemic levels were high disease pressure (HDP), medium disease pressure (MDP), low disease pressure (LDP), very low disease pressure (VLDP) and maximum or total protection (TP). Main plots and replicates were separated by at least 3m and included a 1m-wide barley buffer. Neighbouring varietal effects were minimised through design. A minimum plot-size of 5m2 was used.
Disease establishment and achieving different disease epidemic levels
Mixtures of isolates were used for both diseases. WNB infection was established using conidial suspensions in conjunction with approaching rain fronts. Four applications starting at eight weeks after sowing (WAS) and after 10- to 14-day intervals, resulted in good disease expression. WYS infection was established using spore suspensions as above in WA and by using infected stubble in trials conducted in eastern states Epidemics were promoted using sprinkler irrigation at dusk to maintain extended periods of leaf wetness.
Different disease epidemic levels were generated by varying the amount of inoculum exposure or application. Where naturally infested straw was used to establish epidemics, the ratio of infested and non-host straw was varied such that the same total amount of straw was applied to every plot. Non-host straw was applied first, and the diseased straw was then spread on top.
Trial design and disease establishment for rust diseases (WLR, WSR and WYR)
Trial design
Each trial was sown in a randomised criss-cross or split-plot design of four or five disease levels, five resistance levels and three or four replicates. Disease levels included HDP, MDP, LDP, VLDP and TP. Main plots and replicates were separated by at least 3m and included a 1m wide susceptible spreader or non-host buffer depending on the method used for disease establishment. Neighbouring varietal effects were minimised through design. A minimum plot-size of 5m2 was used.
Disease establishment and achieving different disease epidemic levels
Pathotypes used were Lr 76-1,3,5,7,9,10,12 +Lr37 (“Lr76”) and Sr 34-1,2,7 +Sr38 (“SrVPM”) in WA; Lr 76-1,3,5,7,9,10,12 +Lr37 (“Lr76”) in Victoria and Lr 104-1,3,4,6,7,8,10,12+Lr37 (“new Lr104”) in Queensland. Rust infection was established by introducing infected transplants within pre-sown susceptible spreaders at four WAS or by using urediniospore suspensions on the test plots where non-host buffers were used. Spreaders or test plots were further inoculated with urediniospore suspensions. Epidemics were promoted using sprinkler irrigation at dusk to maintain extended periods of leaf wetness.
Different disease epidemic levels were generated by varying the degree of protection with foliar fungicide or by varying the amount of inoculum exposure or application.
In-season trial management
Appropriate irrigation (where available), weed control and fertiliser regimes were followed to achieve normal plant growth. Selective fungicide sprays were used to exclude non-target diseases, e.g. 250g/ha of Quinoxyfen and 125g/ha Bupirinate to control powdery mildew.
Assessments
Assessment of development scores/heading dates was made at least once during the season. Disease was assessed at least twice during adult plant stages for all diseases, typically between Z49 to Z59 and Z73 from the top two leaves of 10 random tillers per plot. Stem rust was assessed from two tillers per plant. Glume blotch expression of nodorum blotch was assessed on 10 random heads at Z85 and Z87.
Statistical analysis
Response curves describing the relationship between yield and cumulative disease expression across time were derived from multi-environment trial (MET) analyses implemented using a random regression approach in a linear mixed model framework (Forknall et al 2019)). The cumulative disease expression across time was calculated at the plot level as the area under the disease progress curve (AUDPC) using the trapezoidal rule (Simko and Piepho, 2012). As assessment of disease expression on lower leaves can be confounded with senescence due to other causes, only the uppermost leaves (flag and flag-1) were used in the AUDPC calculation for disease expression on leaves. Separate AUDPC curves were fitted for disease expression on leaves and glumes for nodorum blotch. To standardise the disease expression measure across trials for the same disease, the AUDPC was converted to the relative area under the disease progress curve (rAUDPC) by dividing the observed AUDPC by maximum potential AUDPC given the set of assessment dates for each trial (Simko and Piepho, 2012), and combined across the leaf layers within a trial using a weighted average. Where disease expression was assessed at only two assessment dates, the rAUDPC gives the mean proportion of disease expression across the two assessments.
Separate multi-environment trial (MET) analyses were fitted to each disease trial series. For nodorum blotch, separate MET analyses were fitted to the leaf and glume data and the yield data was log e-transformed prior to analysis. All models were fitted with residual maximum likelihood (REML) (Patterson & Thompson, 1971) using the ASReml-R package (Butler, 2018) in the R statistical computing environment (R Core Team 2019).
Box plots were produced for the range of percentage loss caused by yellow spot, nodorum blotch, stem rust and leaf rust in WA and for stripe rust over east comparing yields observed in the disease epidemic level plots relative to yields in protected plots for MR/MRMS varieties, MS/MSS varieties and S/SVS varieties.
Results
Yield response curves are presented for a representative trial for yellow spot, nodorum blotch, stem rust and leaf rust done in WA and for a stripe rust trial done in NSW. Disease epidemic levels were well achieved for all trials presented and resistance categories were well reflected in the yield response curves (Figure 1). Differences in varietal yield potentials within locations were evident from the Y intercept for the variety regression lines, at zero or low disease severity. Total disease (expressed as cumulative disease expression across time) increased with the susceptibility of the varieties to the particular pathogen, resulting in correspondingly higher yield loss in various trials. Partially resistant varieties showed lower disease and slower disease development rather than delayed disease appearance on the leaf surface. Curves for the partially resistant varieties were shorter than curves for the susceptible varieties reflecting lower levels of disease expression and less yield loss. The slopes of the curves of various varieties in different trials were significantly different from zero but were not significantly different from each other in most trials indicating no differences in disease tolerance (ability of a variety to maintain yield in the presence of infection) among varieties. Slopes were generally steeper in the rust trials as compared to the leaf spot trials validating the more damaging nature of rust diseases
For nodorum blotch, yield response curves are presented for the 2016 trial in South Perth, WA (Figures 1A & 1B). A non-linear yield loss function was observed for nodorum blotch indicating that yield is most affected during early stages of the disease. Yields of disease-protected plots was ranged from 3.6 to 4.4t/ha in response to leaf disease (Figure 1A) and 3.8 to 4.9t/ha in response to glume disease (Figure 1B). The most susceptible varieties expressed highest burdens of both leaf (Figure 1A) and glume (Figure 1B) disease. At the highest leaf disease burdens, highly susceptible varieties lost between 2.3 to 2.7t/ha. In contrast, a variety with higher levels of partial resistance expressed lower burdens of total disease and lost around 1.4t/ha. The result indicates that partial resistance to nodorum leaf blotch reduced yield loss from 40 to 47% of losses observed in susceptible varieties contributing significantly to protecting yield in disease-conducive situations. Similar results were observed for glume disease. Although we have no way of separating out the yield loss from disease on leaves and that from disease on glumes in these trials, it has been observed that leaf infection has a stronger effect on yield than glume infection.
For yellow spot, yield response curves are presented for the 2016 trial conducted in South Perth, WA (Figure 1C). The yield loss function for yellow spot was linear, determined by the extent of disease expression. Yields of disease-protected plots were 3.3 to 3.5t/ha. At the highest disease burdens, the most susceptible varieties lost between 1.5 to 1.7t/ha. In contrast, varieties with the highest levels of partial resistance expressed lower disease and lost between 0.8 to 1.0t/ha. The results indicate that partial resistance to yellow spot reduced yield loss to 46 to 50% of losses observed in susceptible varieties contributing significantly to protecting yield in disease-conducive situations.
For leaf rust, yield response curves are presented for the 2016 trial in Carnarvon, WA (Figure 1D). The yield loss function for leaf rust was linear, determined by the extent of disease expression. Yields of disease-protected plots were 4.2 to 5t/ha. At the highest disease burdens, the most susceptible varieties lost between 2.4 to 3t/ha. In contrast, varieties with the highest levels of partial resistance expressed lower disease and lost between 0.3 to 1.1t/ha. The result indicates that partial resistance to leaf rust reduced yield loss to 65 to 89% of losses observed in susceptible varieties indicating the relatively high effectiveness of partial resistance to leaf rust. The variety Mace was classified as MS at the time the trial was done. Its rating has since gone down to MSS with the incursion of new pathotypes.
For stem rust, yield response curves are presented for the 2015 trial in Carnarvon, WA (Figure 1E). The yield loss function for stem rust was linear, determined by the extent of disease expression. Yields of disease-protected plots were 2.9 to 3.1t/ha. At the highest disease burdens, the most susceptible varieties lost between 2.5 to 3t/ha. In contrast, varieties with the highest levels of partial resistance expressed lower disease and lost 1.3t/ha. The result indicates that partial resistance to stem rust reduced yield loss to 50 to 57% of losses observed in susceptible varieties contributing significantly to protecting yield in disease-conducive situations.
For stripe rust, yield response curves are presented for the 2016 trial in Wagga Wagga, NSW (Figure 1F). The yield loss function for stripe rust was linear, determined by the extent of disease expression. Yields of disease-protected plots were 3.4 to 6.2t/ha. At the highest disease burdens, the most susceptible varieties lost between 2.7 to 3.4t/ha. In contrast, varieties with the highest levels of partial resistance expressed lower disease and lost between 1.1 to 1.4t/ha. The result indicates that partial resistance to stripe rust reduced yield loss to 59% of losses observed in susceptible varieties indicating the relatively high effectiveness of partial resistance to stripe rust.
Box plots produced for the range of percentage loss caused by various diseases indicate that stem rust and nodorum blotch are more damaging than stripe rust, leaf rust and yellow spot (Figure 2) and that it is important to choose an MR/MRMS variety for these two diseases in high-disease risk scenarios.
An online model has been developed so growers and consultants can make more informed decisions about variety and paddock selection by being able to compare yield responses to various resistance categories of individual diseases.
Conclusions
This study provides the first set of definitive results demonstrating yield loss responses to wheat foliar diseases as influenced by variety partial resistance, epidemic intensity and environment. Partial resistance was effective in reducing losses from all diseases for current commercial wheat varieties. Growers and consultants can now make more informed decisions about variety and paddock selection by being able to compare yield responses to various resistance categories of individual diseases.
References
- Butler DG, Cullis BR, Gilmour AR and Gogel BJ (2018). ASReml-R 4 reference manual: mixed models for S language environments. Queensland Department of Primary Industries and Fisheries.
- Forknall C, Kelly A, Simpfendorfer S, Verbyla A and Faveri JD (2019). An across trials random regression approach to describe tolerance of wheat cultivars to disease. Biometrics by the Botanic Gardens - International Biometric Society Australasian Region Conference, Adelaide, South Australia.
- Patterson HD and Thompson R (1971). Recovery of inter-block information when block sizes are unequal. Biometrika 58:545-554.
- R core Team (2019). R: A language and environment for statistical computing. R Foundation for Statistical Computing, Vienna, Austria. URL http://www.R-project.org/
- Simko I, Piepho HP (2012). The area under the disease progress stairs: calculation, advantage and application. Phytopathology 102: 381-389.
Acknowledgments
This research is supported by the Grains Research and Development Corporation (GRDC). Support from collaborating biometricians Alison Kelly and Clayton Forknall and GRDC consultant Allan Mayfield is duly acknowledged. We also thank Donna Foster for yellow spot inoculum production for South Perth trials and Bob Vinson for his assistance at Carnarvon Research Station.
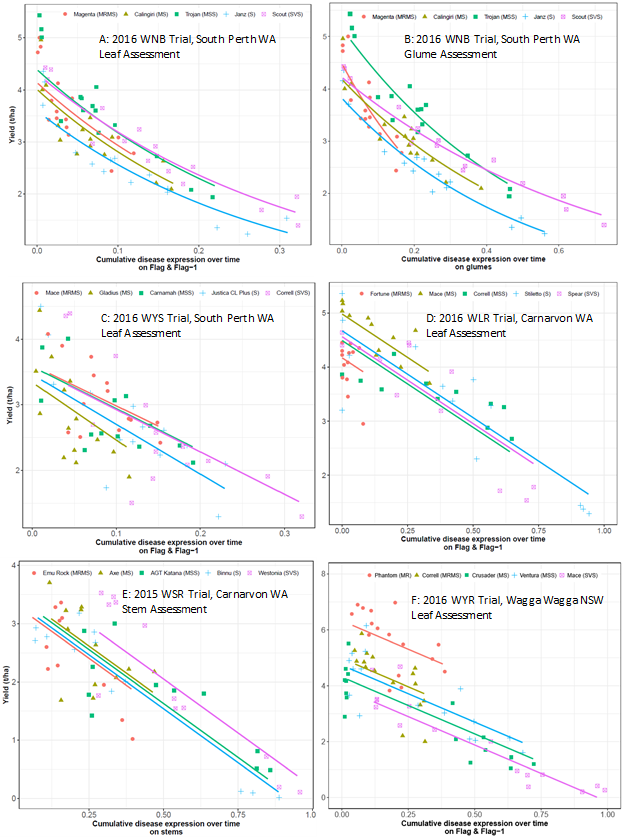
Figure 1.Yield response curves for cumulative disease expression over time for nodorum leaf blotch (A), nodorum glume blotch (B), yellow spot (C), leaf rust (D), stem rust (E) and stripe rust (F).
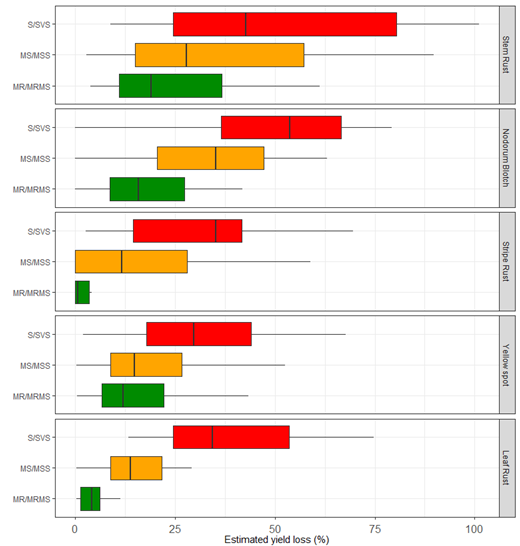
Figure 2. Box plots for the range of percentage loss caused by stem rust, nodorum blotch, yellow spot and leaf rust in WA and for stripe rust over east comparing yields observed in the disease epidemic level plots relative to yields in protected plots for MR/MRMS varieties, MS/MSS varieties and S/SVS varieties.
GRDC Project Code: DAW00245,
Was this page helpful?
YOUR FEEDBACK