Nitrogen management. A seasonal journey with many routes and destinations
Author: Chris Dowling (Back Paddock Company) | Date: 04 Dec 2018
Take home message
With the decline in native soil N fertility the once smoother road of seasonal nitrogen (N) management has now become a bumpy “goat track”. Strategic and tactical fertiliser decisions are more critical than ever in ensuring every drop of crop available water counts.
Ammonia volatilisation from surface spread urea
- Ammonia volatilisation from surface spread ammonium forming fertiliser such as urea, ammonium sulphate and ammonium phosphates is a natural soil process occurring in pristine natural environments from animal urine patches. The real discussion in cropping and pastures is about the cumulative loss and its cost, and the trigger point for losses to necessitate product or practice change
- In our high clay content soils, ability to trap ammonia (NH3) as it is created during the breakdown of urea (via soil CEC) is more important than soil pH
- Ammonia volatilisation losses in high clay content soil may be significantly less than first thought
Vertical nitrogen movement in the soil during fallow
- Using single factor old “rules of thumb” that relate soil wetting depth to subsequent nitrate-N movement down the profile, clearly over- estimate N movement in clay soils and in order to be more realistic, need to be recalibrated to include consideration of the starting soil water distribution, time of year and post application rainfall patterns
- Outputs of soil moisture accumulation modelling tools (Soil Water App, CliMate) are likely to be more realistic than old “rules of thumb” and possibly good tools to develop new N movement perspectives.
N Budgets or N Fudgets?
- Changes in soil N supply, farming practice and fertiliser technology suggests outputs from traditional N budgets may be insensitive to changes such as reduced lower native soil N fertility, higher frequency of pulses, ley cropping and differences in fertiliser uptake efficiency
- Reduction in availability of native N and increased N from legume rotations and/or stored mineral N, makes fertiliser N management more critical than in the past due to the loss of seasonal “buffering” these sources of N provided
- 1 kg residual soil mineral N located between 10 and 60 cm in the soil profile and N mineralised in crop may be 1.5 – 3 x as effective 1 kg N as fertiliser N in the year it is applied.
Ammonia volatilisation losses from surface applied urea and ammonium fertilisers
Nitrogen (N) fertiliser inefficiency driven by accelerated ammonia volatilisation is real. The appropriate discussion is probably about risk, likely amount, and trigger point for losses to necessitate product or practice change.
Prior to recent work by Graham Schwenke (Schwenke 2014), our knowledge of process and risk of ammonia volatilisation in vertosols was influenced by work in soils and conditions unlike those that exist in the northern grains region. Putting it simply, from local vertosol based research it now appears in these high clay content soils, their ability to trap the ammonia created during the breakdown of urea, is more important than soil pH in determining the amount of ammonia volatilised. Losses measured from research in lower clay content soils and climatic areas, indicates a dominance of soil pH in the ammonia volatilisation process. Graeme Schwenke’s research showed that in many circumstances ammonia volatilisation losses are significantly less than first thought in our high clay content vertosols.
Table 1. Key factors controlling ammonia volatilisation rate and total N loss from urea application.
Factors | Effect |
|---|---|
Soil cation exchange capacity | Higher CEC = higher ammonia adsorption rate and adsorption capacity = lower loss rate |
Soil pH | Higher pH = more rapid rate |
Micro- meteorological conditions | Higher temperature and wind speed = increased loss rate |
Granule location | Higher soil contact/cover = lower loss rate |
Granule wetting | Incomplete wetting = increased loss |
Time | Increased time in unfavourable conditions = greater total loss |
Because future weather conditions (particularly rainfall and wind) are significant factors in the loss process, predicting absolute loss accurately is not possible. Gaining a perspective of the relative loss and costs of various application tactics is useful in making the trade-off between obtaining highest N efficiency and N application logistics (time, coverage of area, soil moisture loss, available labour and equipment etc). The model suggested by Fillery and Khimashia 2016 provides a useful approach to compared potential loss from differ N application strategies.
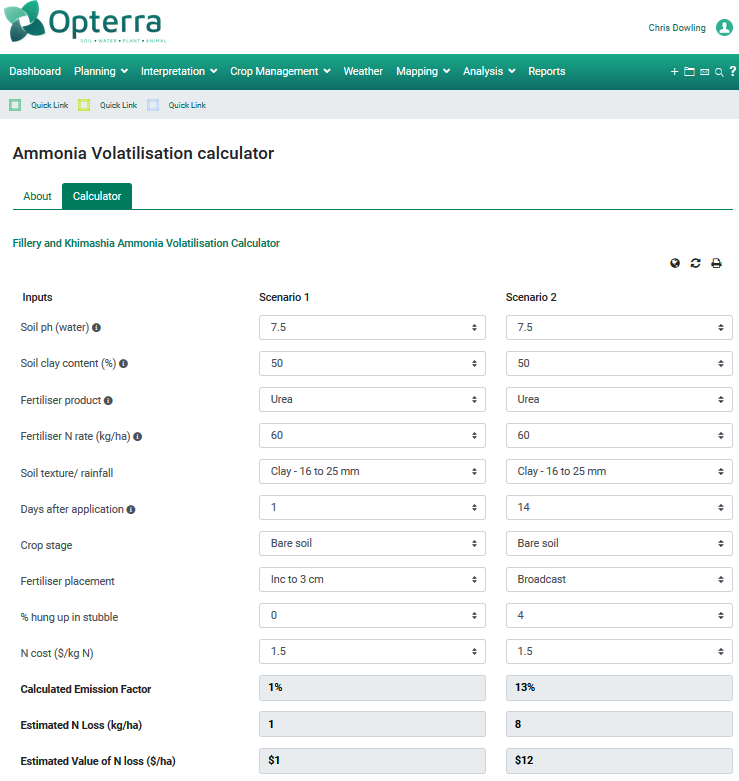
Figure 1. An example of an ammonia volatilisation scenario comparison. Broadcast and incorporated vs broadcast only,
no rain 14 days. Calculator (based on Fillery and Khimashia 2016).
How fast does nitrogen move in the profile in vertosol and scrub soils?
Whether it be urban real-estate, farm location, or nutrient distribution in soil, ‘location, location, location’ is a key to success. This has been demonstrated for P and K in CQ, but the same principles apply for N, particularly where the crop is highly dependent on fertiliser N derived from a single application. The difference between the P, K and N, is that N (when in the urea, nitrite and nitrate forms) is a mobile nutrient - meaning that it doesn’t necessarily need to be placed at a particular location. Soil water movement can be used to help achieve an appropriate soil N distribution from a range of application methods.
The distribution of nutrients relative to root density and soil available moisture is the main game for efficient uptake. How you get there is somewhat dependent on rainfall, but there are some key factors that need to be considered in providing some possibility to getting targeted soil N distribution.
Key factors in determining appropriate soil N distribution include
- Current soil N distribution
- Current quantity and distribution of soil water
- Critical crop N stages
- Crop root structure
- Soil profile physical, chemical and biological characteristics
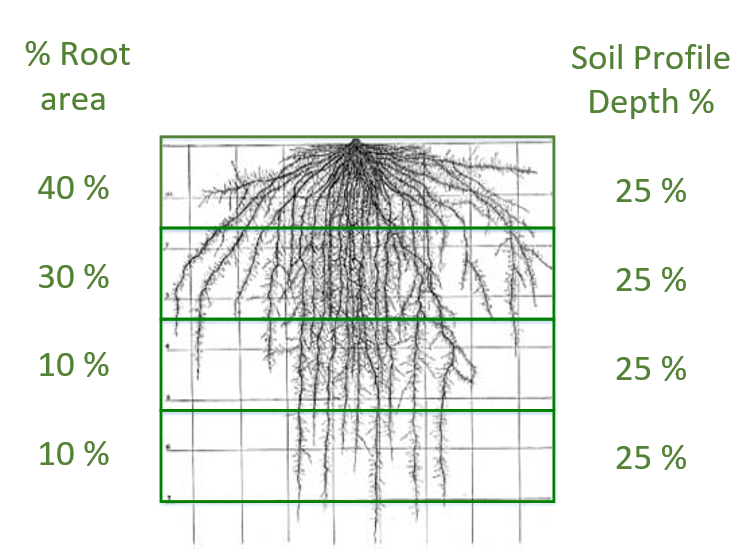
Figure 2. Generalised soil root distribution for cereal crops at maturity
Efficient nutrient uptake is achieved by having the appropriate concentration in a soil layer, co-located with crop available water and high root density.
The rate of soil water movement in cracking clay soil can be difficult to predict, being affected by factors such as cracking and swelling, and their interaction with rainfall patterns.
Irrespective of a soil type, once N is in the nitrate (NO3-) form it is mobile in the soil, moving laterally and horizontally with water movement.
Probably the scenario most reliably predicted is when N applied to a full moisture profile is unlikely to move far due to restricting internal water flow due to the lack of cracks (preferential flow) and soil swelling (effect on soil water potential and capillary rise). However, applying fertiliser N to a dry profile does not necessarily guarantee well distributed N due to its reliance on interactions with rainfall patterns.
Recent research reported by Richard Daniel for southern Queensland and northern NSW (Daniel et al. 2018) suggests that nitrate - N movement down the profile during a summer fallow as it fills may not be as great as generally expected when considering the total rainfall received and applying old “rules of thumb” (Figure 3).
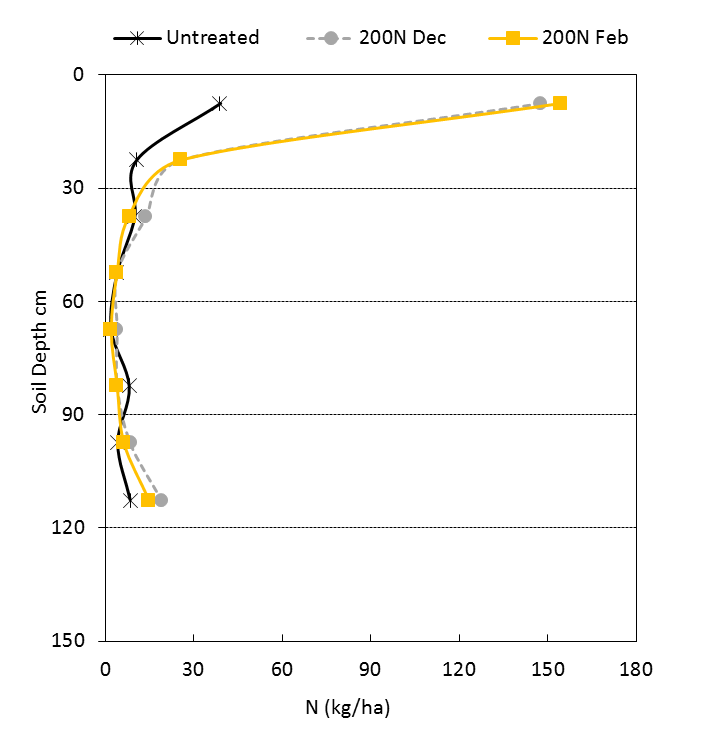 Figure 3. Soil distribution of N at Tulloona at planting (June 2016) following application of urea in
December 2015 or February 2016. (Daniel et al 2018 ).
It becomes clearer when looking at rainfall and evaporation patterns that the amount and timing of rainfall (Figure 4) would be unlikely to provide sufficient excess soil water in surface layers to create significant percolation of water and nitrate-N deeper into the soil.
The rate of conversion of urea to nitrate-N in the initial 30 days after application may have also impacted these results and explain the lack of movement resulting from the 4 days of rain in early January 2016. If the majority of the N in was still ammonium, movement in soil water would be minimal.
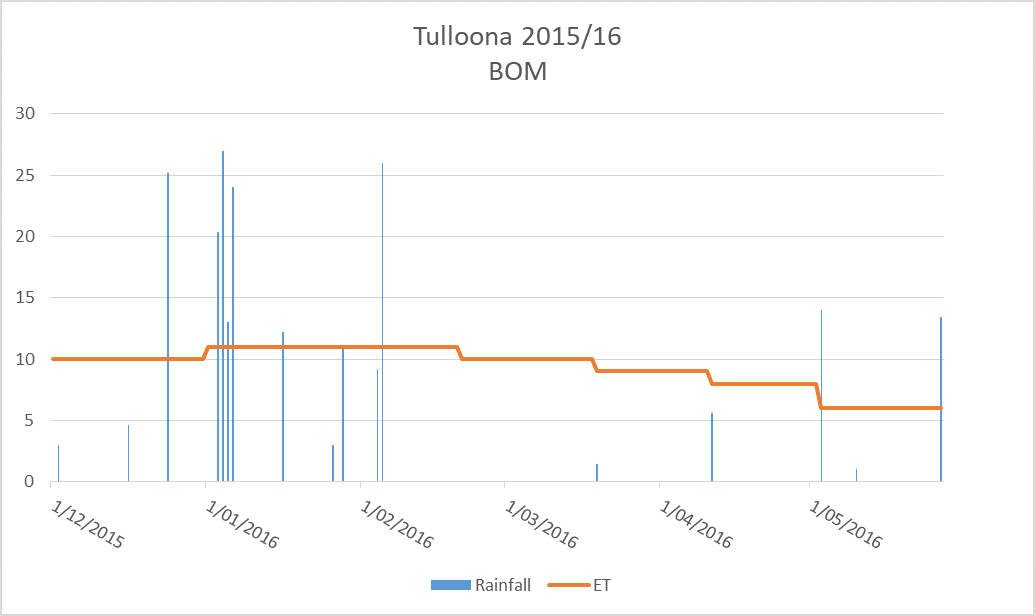
Figure 4. Seasonal rainfall and ET at Tulloona (BOM Coolanga) for the period
December 2015 to June 2016.
Using single factor old “rules of thumb” that relate soil wetting depth and subsequent nitrate-N movement down the profile clearly over- estimate N movement in clay soils and in order to be more realistic, need to be recalibrated to include consideration of the starting soil water distribution, time of year and post application rainfall patterns. Outputs of soil moisture accumulation modelling tools (Soil Water App, CliMate) are likely to be more realistic than old “rules of thumb” and are possibly good tools to develop new N movement perspectives.
N Budget or N Fudget?
A brief history of the N budget
As a result of the big dry in the early mid 1990s it was felt that the old system for determining N requirement (largely hard copy single dimension lookup tables – CFL Soil Test Interpretation Manual) needed improvement. To cope with yield and protein dynamics and variable soil mineral N status post drought, an N education program (Nitrogen in 95) was developed by then QDPI and CFL. The training process subsequently morphed into what we now know as the ‘N Budget’. Given that more than 20 years have passed since the original budget calculations were developed, it is not unexpected that “cracks” are appearing and new scenarios are appearing that are not catered for in the original N Budget.
So what’s changed in that time that may affect N budgets I here you ask? The following is a list of candidate issues:
- Fallow practices (reduced soil disturbance frequency and intensity = decreased mineralisation)
- Older soils with lower OC % (Figure 5)(reduction in native organic N = decreased mineralisation) (Bell et al. 2010)
- Increased fallow efficiency (increased yield potential = increased N demand)
- Change in grain marketing (downward trend in wheat quality premiums = lower N demand)
- Increase in non-cereal crops in the rotation (increase labile N = short term seasonal boost N supply and uptake efficiency = decrease in the need for fertiliser N)
- More volatility in grain price/N cost ratio (increase volatility = multiple yield scenario approach)
- Availability of proximal and remote sensing to judge crop performance and spatial variability (in crop performance date = ability detect and act on unplanned scenarios)
- Wider range of N application equipment and product options (more in-crop application options = ability to implement fertiliser scenarios with higher NfUE.)
- Greater validation of finer detail of workings of parts of N cycle in vertosols of the north (flexibility = ability to create more realistic scenarios).
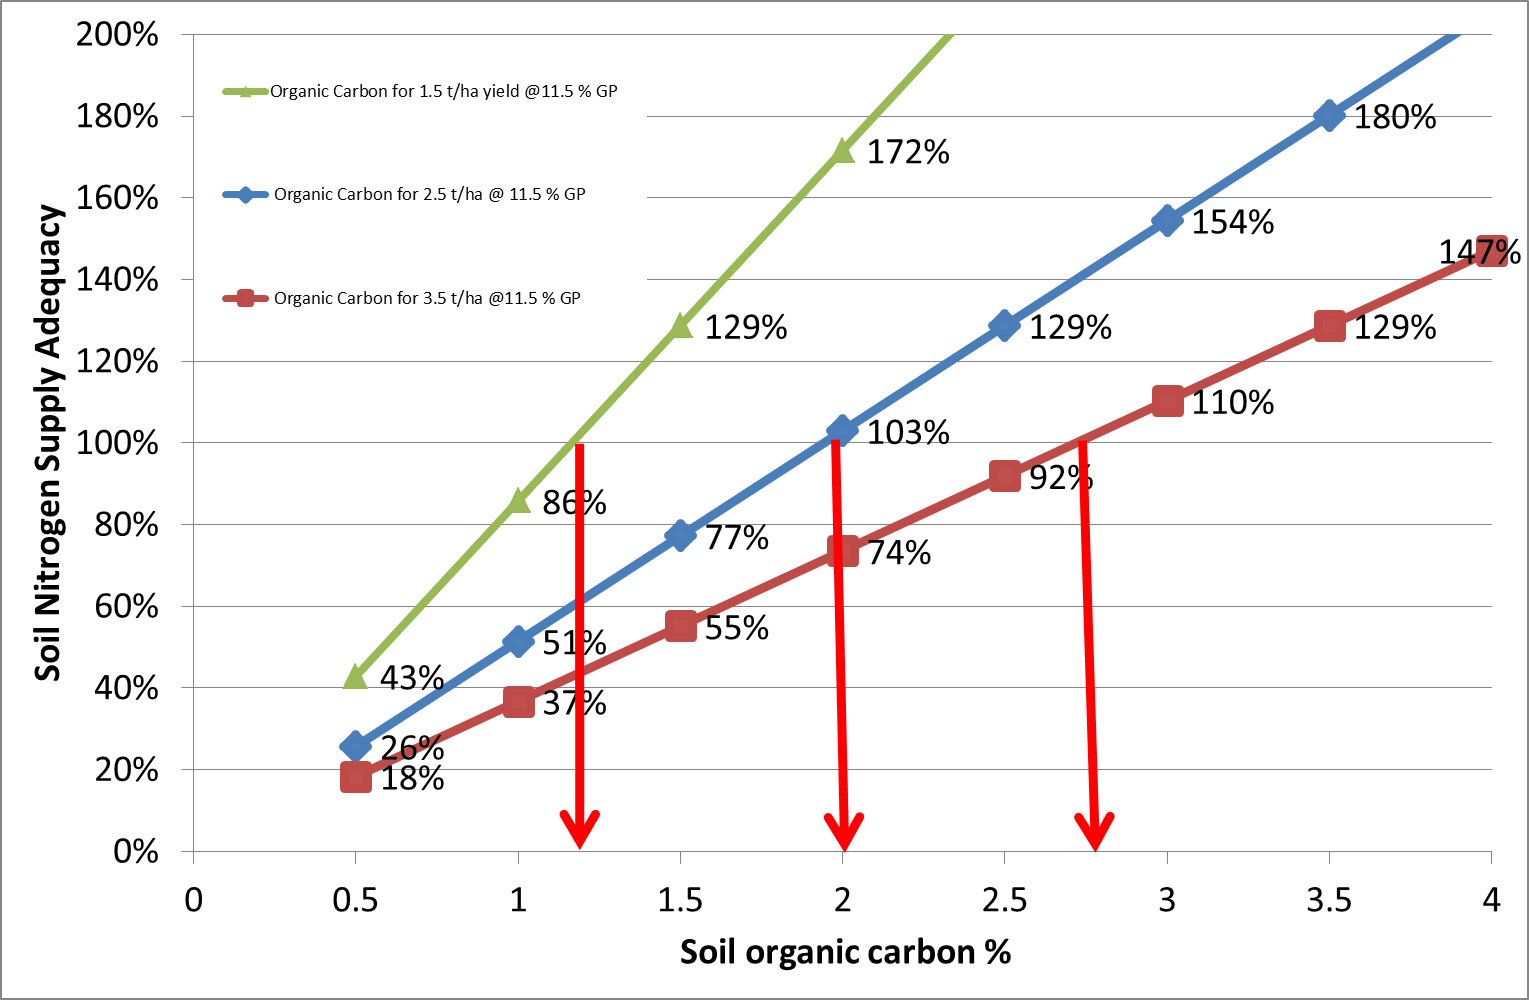 Figure 5. As the contribution from organic matter derived nitrogen declines (OC %), the dependence on other seasonal N sources increases. The rate of replacement N required depends on strategies and tactics employed by managers
to supplement the main supply pools.
An N budget tries to define the status of a range of soil N supply pools at a point in time and its ability to supply crop demand for a likely yield range. The accuracy of the prediction of N requirement is dependent on 4 main factors:
- The size of the N pool
- The efficiency of uptake from the pools
- Soil water availability to match N availability
- Ability to supplement the deficit with effective fertiliser tactics.
Table 2. General range of short term crop uptake efficiency of N from four major supply pools by cereals.
Major Soil N Supply Pool (and crude working definition) | General Crop Uptake Efficiency in Cereals1 |
|---|---|
Humic OM - contributed after more than 3 seasons of mineralisation | 70 – 90 % |
Labile OM - contributed from crop residues with less than 3 seasons of mineralisation | 70 – 90 % |
Soil profile mineral N - nitrate and ammonium below 10 cm at sowing | 50 – 70 % |
High concentration, rapidly mineralisable fertiliser N - applied in fallow, - applied in crop | 10 – 40 % 20 – 60 % |
1. Does not include any significant seasonal episodic loss event.
Crop N supply pools are not all the same, differing in both quantity of N supplied and efficiency of crop uptake (Table 2). Significant changes in the N supply pool balance and crop N uptake efficiency each can have a profound effect on crop N supply and seasonal fertiliser N requirement.
References
Richard Daniel, Rachel Norton, Anthony Mitchell, Linda Bailey, Denielle Kilby and Branko Duric (2018) Nitrogen Use (In) Efficiency In Wheat – Key Messages From 2014-2017, GRDC Update Paper.
Ian R. P. Fillery and Nirav Khimashia (2015) Procedure to estimate ammonia loss after N fertiliser application to moist soil. Soil Research 54(1) 1-10.
Graham Schwenke (2014) Nitrogen volatilisation : Factors affecting how much N is lost and how much is left over time. GRDC Update Paper.
Mike Bell, Phil Moody, Kaara Klepper and Dave Lawrence (2010) Native soil N decline. The challenge to sustainability of broadacre grain cropping systems on clay soils in northern Australia, 9th World Congress of Soil Science, Soil Solutions for a Changing World, 1 – 6 August 2010, Brisbane, Australia.
Contact details
Chris Dowling
Back Paddock Company
Unit 1 / 13-15 Steel St, Capalaba, QLD 4157
Ph: 0407 692 251
Email: cdowling@backpaddock.com.au
Was this page helpful?
YOUR FEEDBACK
